Newrelic APM - observability for early-stage PHP projects
Overview of using NewRelic in PHP projects from 1RPM to ±80000 RPM.
Early-stage project issues
As a startup most companies usually focus on releasing MVP (minimum viable product) and enter the early-adopters market, and rarely invest resources into topics like
- Observability, Tracing, EventSourcing, CQRS
- Code quality tools
- Long-term vision, flexible architecture
- Unit/Testing, functional testing, integrational testing
- Performance optimizatios
- Security audit
- Internal audit & logging, compliance frameworks
- Testing, staging environment, dedicated QA engineering team
at best projects starts with some framework, coffee, friday pizza and few team-mates.
Measurement toolbox
Part of scientifical approach to solve a problem is measurements.
Without measurements, one could only assume what happens when changes are deployed to remote servers, based on previous “knowledge” and expertise.
In reality code will not work the same way on a 2-4 code x86 laptop and on Xeon/Opteron cloud KVM/xVM virtualized machine.
A good example of this is effort by Debian OS team named ReproducibleBuilds, an attempt to reach binary-identical application builds.
Docker
Docker attempts solve the build and delivery problem of shipping the application with some API contracts/cgroups (disk, memory, cpu).
Docker is still reuses the kernel of the host differences between Docker and VirtualMachine), and that “cloud runtime” would not be the same as local environment.
Cloud runtime
The application runtime is virtual, see AWS Nitro System
- virtual networks, SDN, AWS VPC, AWS Api Gateway
- virtual disk, see AWS EBS Volumes
- virtual CPU’s, see AWS EC2 Instance Types, AWS Lambda
- virtual architecture (emulation) HVM, PV, cpu instructions, cpu cache, dedicated hosts …
- difference between executing against local and managed services
- Redis vs AWS Elasticache
- local os filesystem vs AWS S3 vs Min.io
- Oracle MySQL vs AWS RDS MySQL vs AWS DynamoDB vs LocalDynamoDB
What is NewRelic
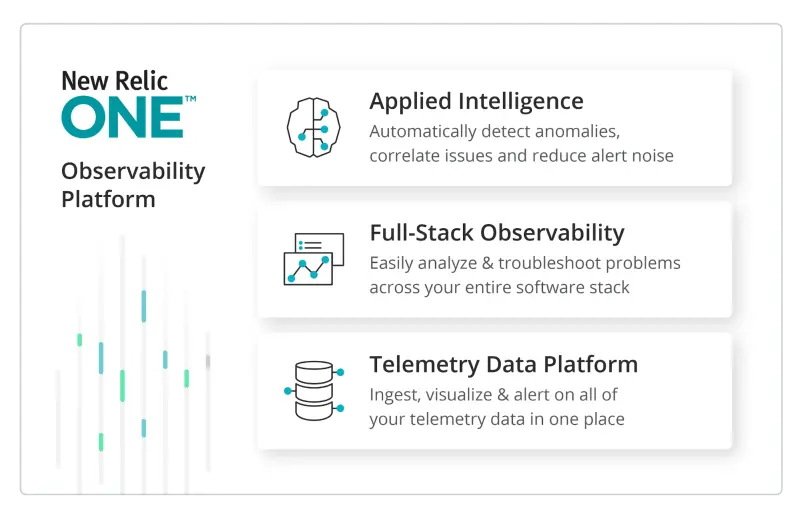
Why use NewRelic
From early 2012 NewRelic was trying to address this issues, and provided what is currently named “Observability”
- Logs
- Metrics
- Tracing
This is what NewRelic APM provides.
- Sidecar container for collecting metrics with 0-performance overhead
- PHP extension with kernel-level access to resources
- Cloud console for monitoring, alerting, aggregation (i.e. Graphana, PagerDuty, Kibana) all together
- Well documented and production tested (crash free) commercial solution
- Logs collector
- Performance metrics collector
- Traces collector
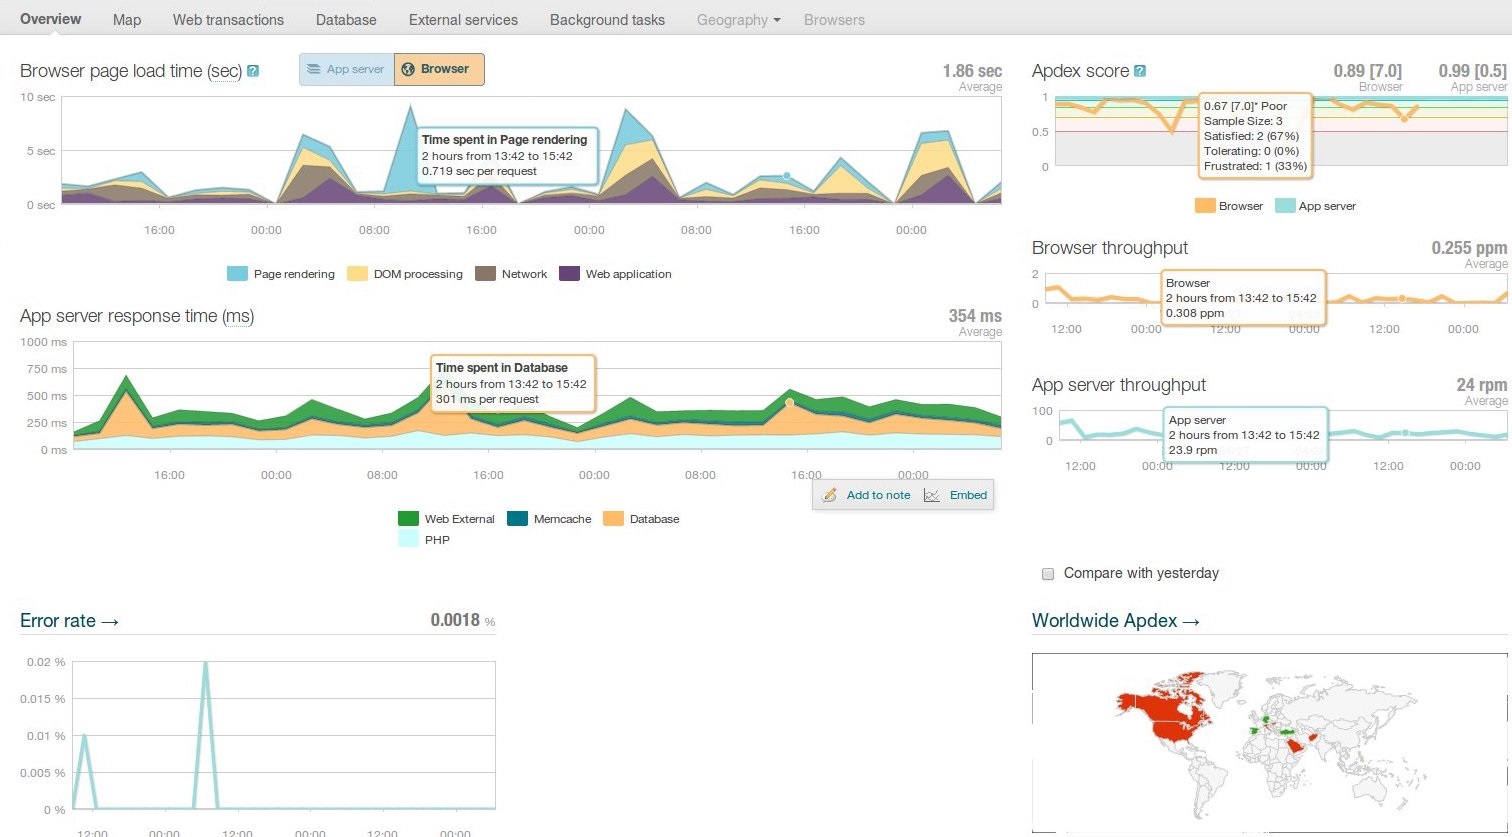
Monitor your app’s Apdex (end-user satisfaction)
NewRelic defines AppDex user satisfaction metric as health, and as developer you can customize this value
appdex OK = response time < 1s
appdex WARNING = response time between 1s and 2s
appdex ERROR = response time >2s
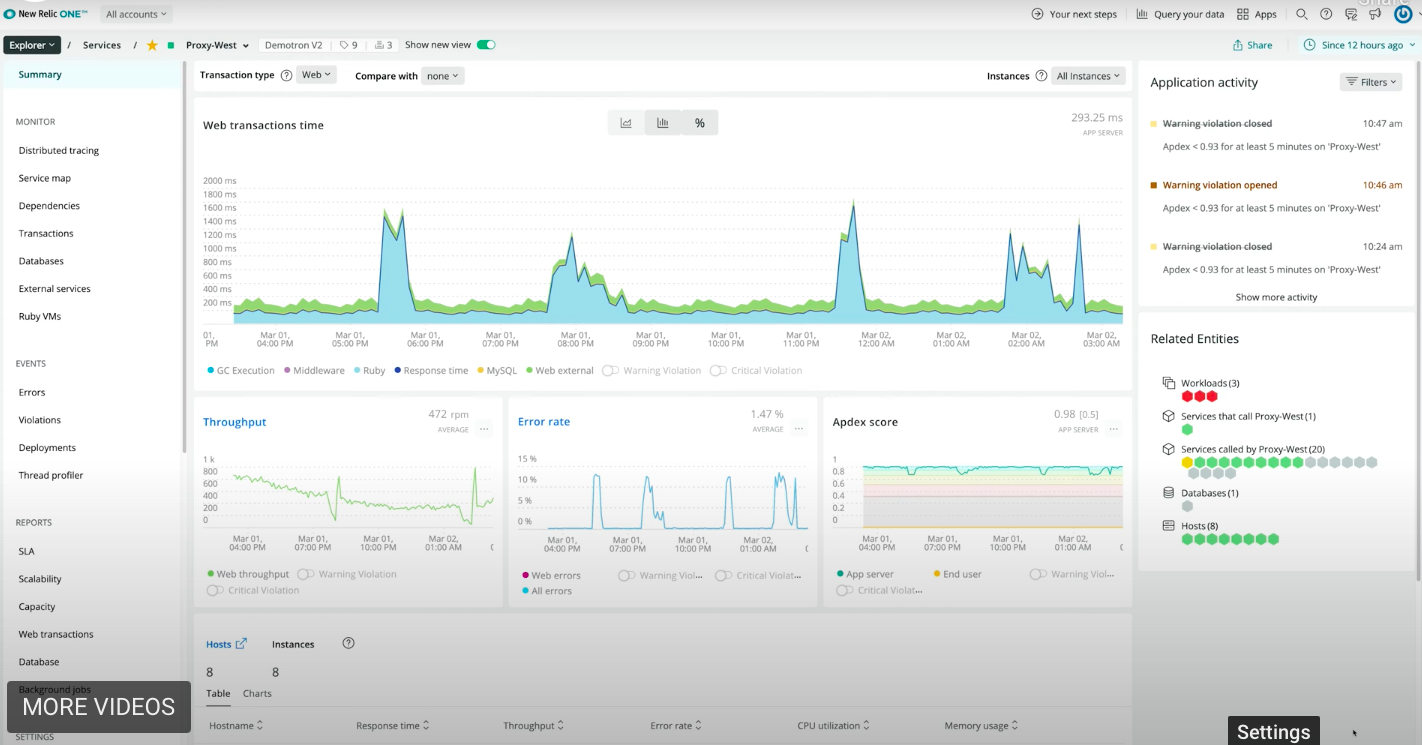
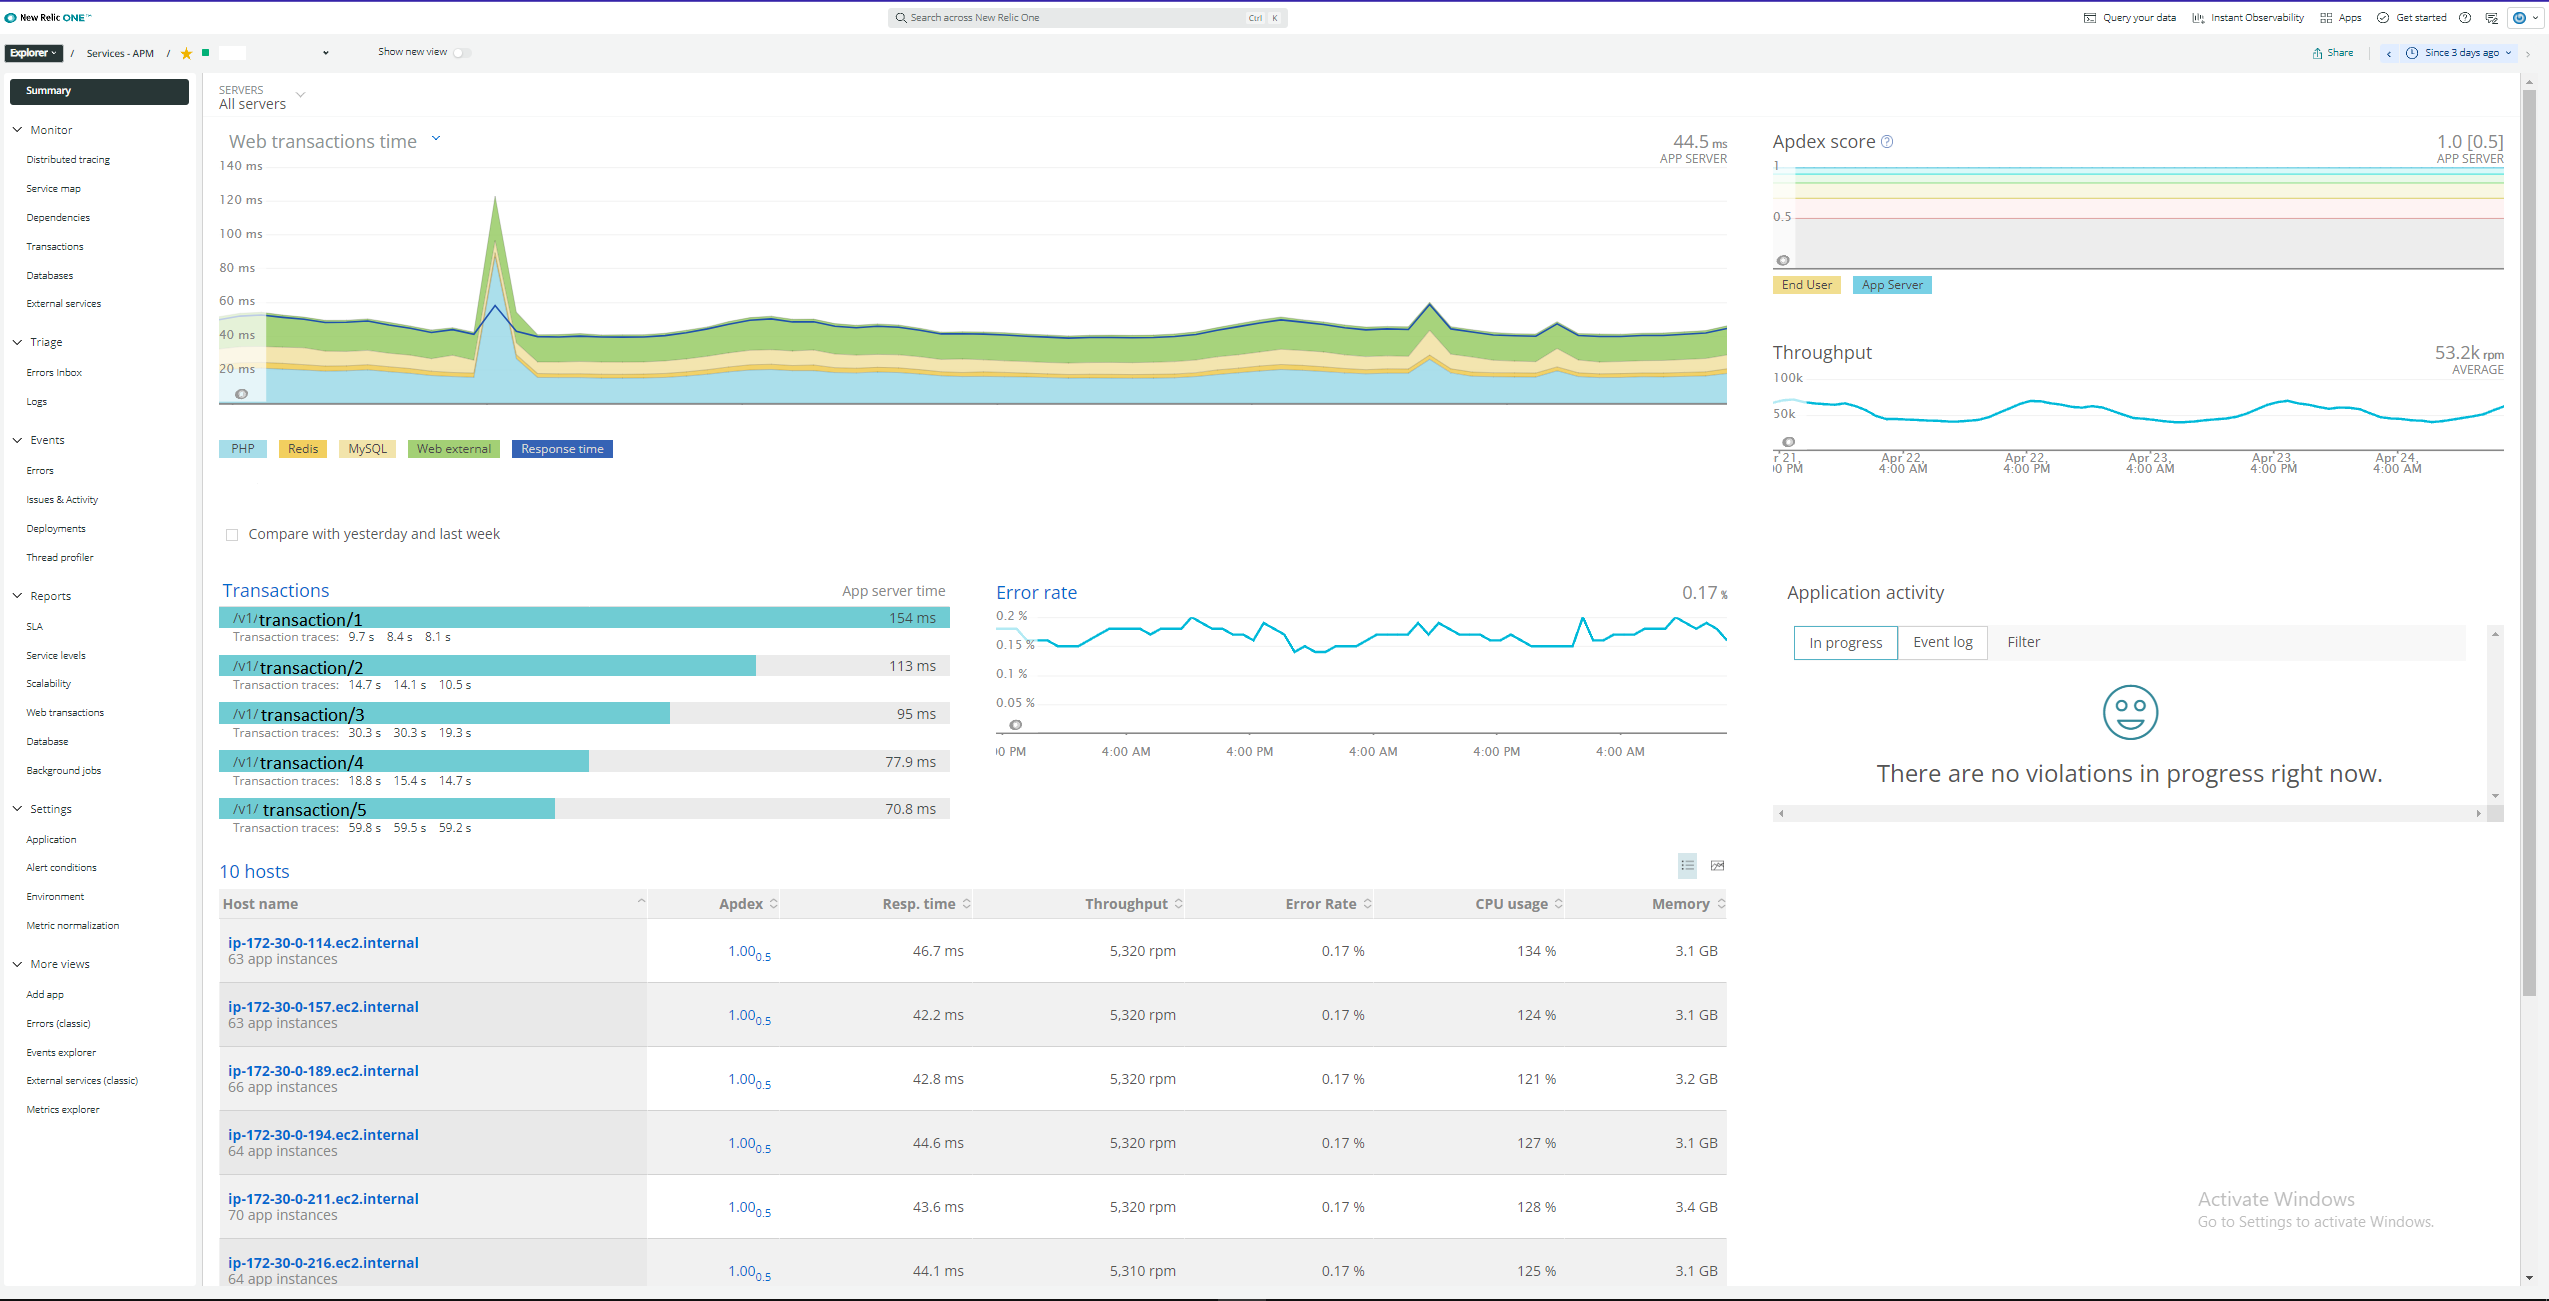
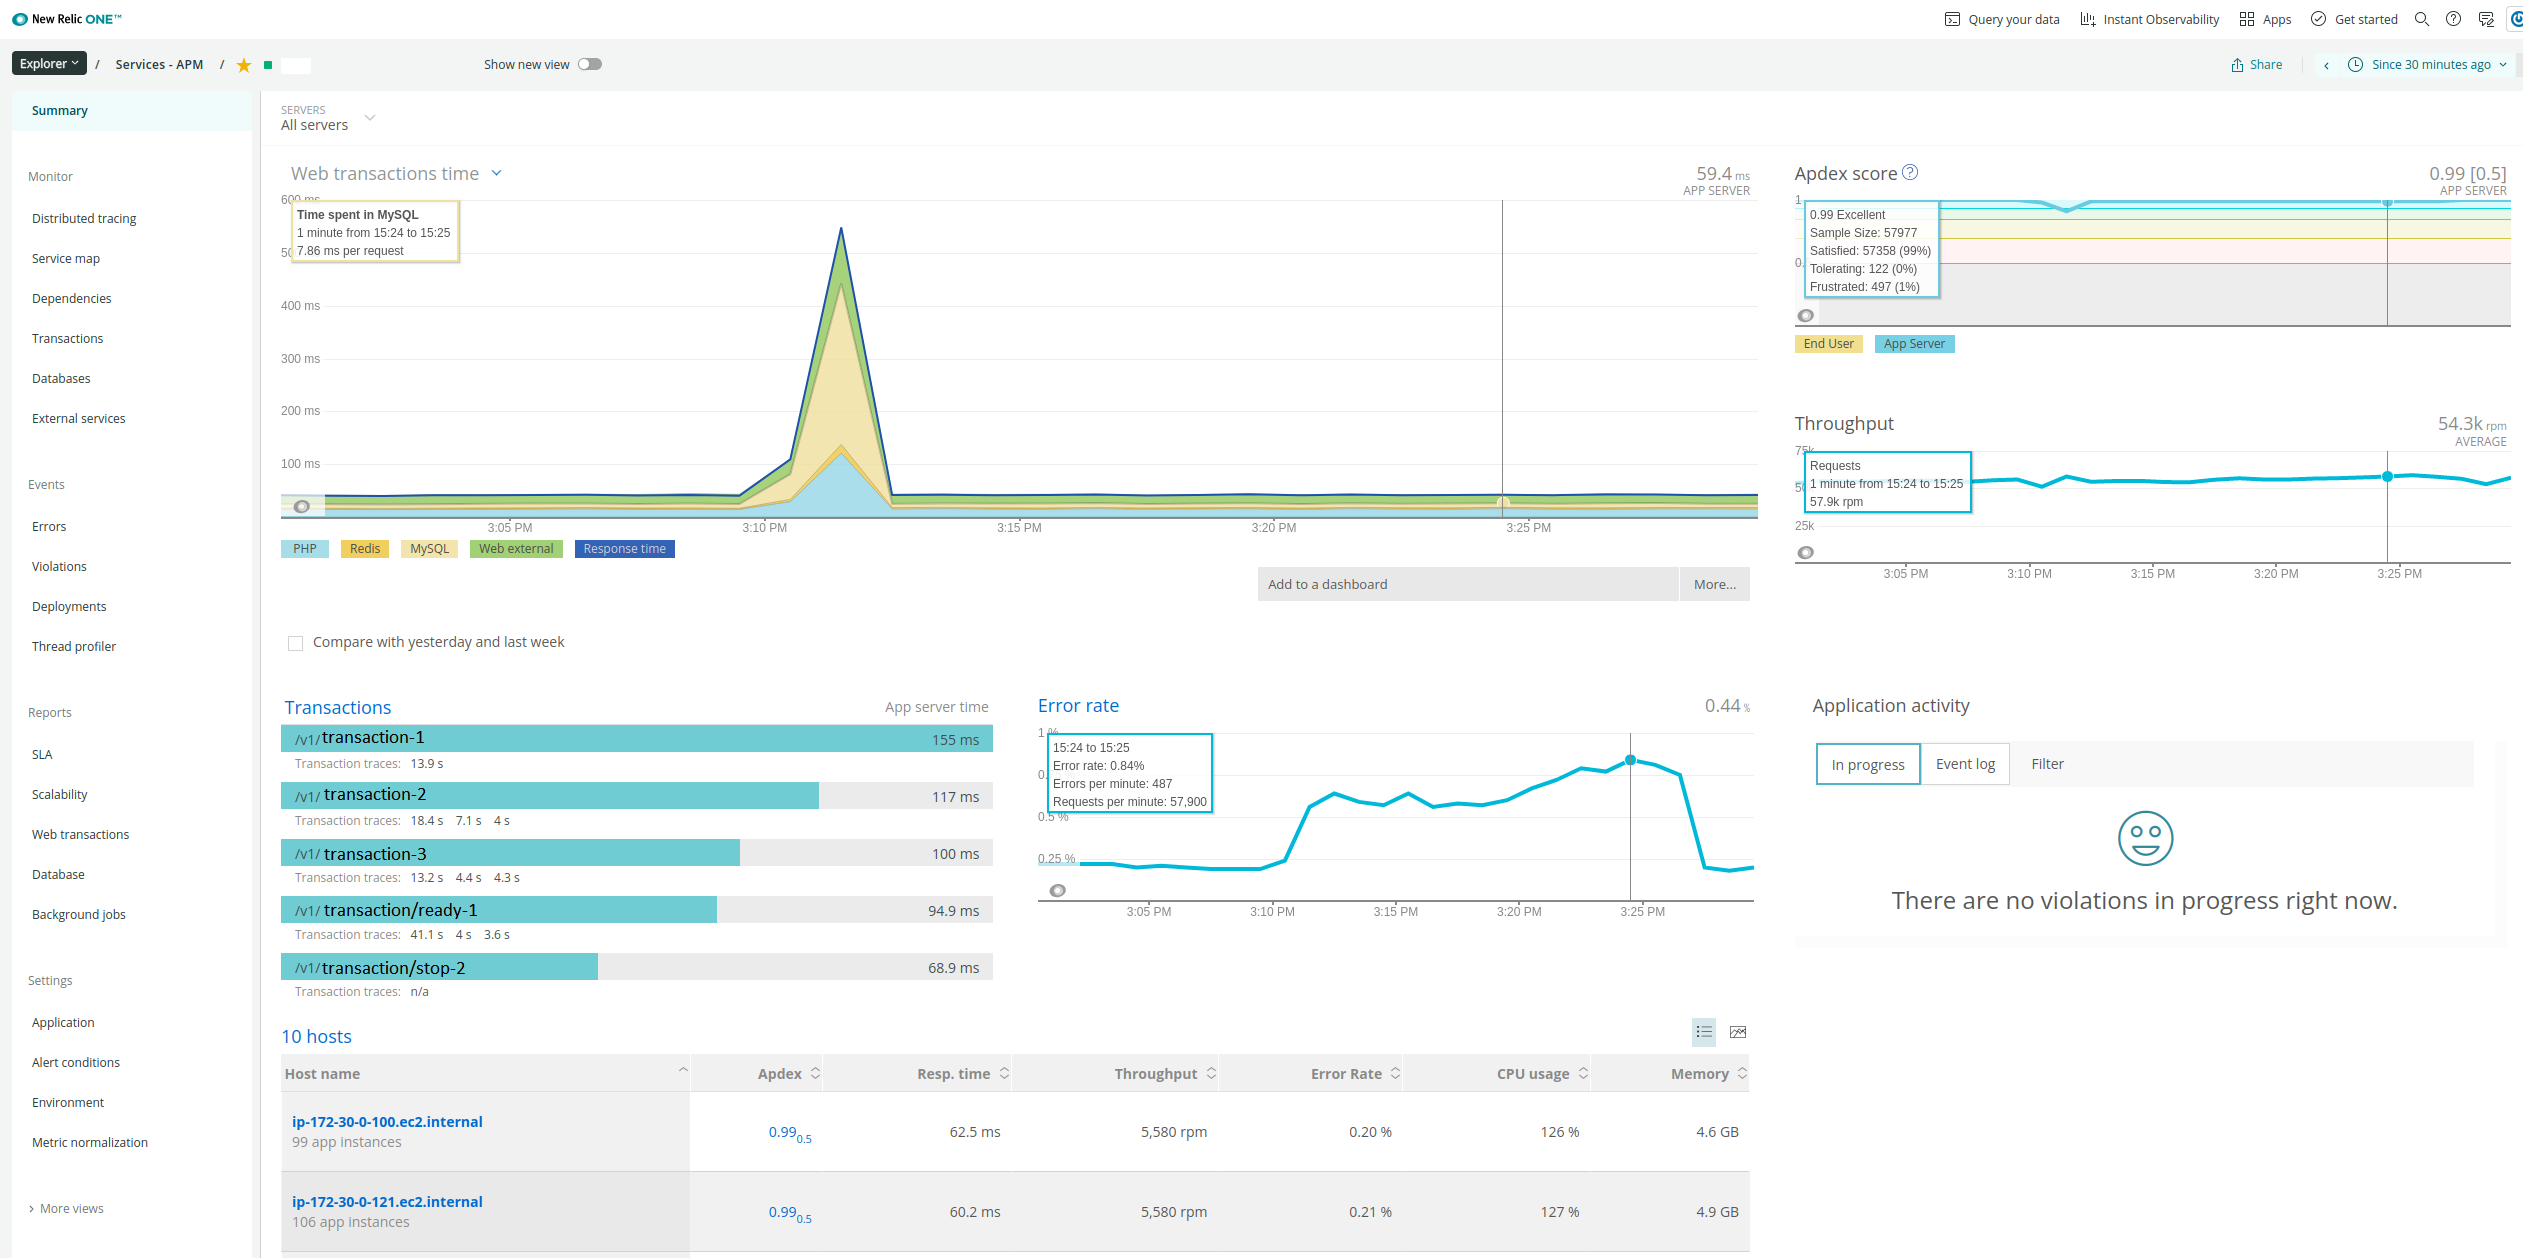
NewRelic overview
High-level summary & low-level details of your app in production.
- Response time
- Throughput
- Error rate
- CPU usage
- Memory
- Summary overview
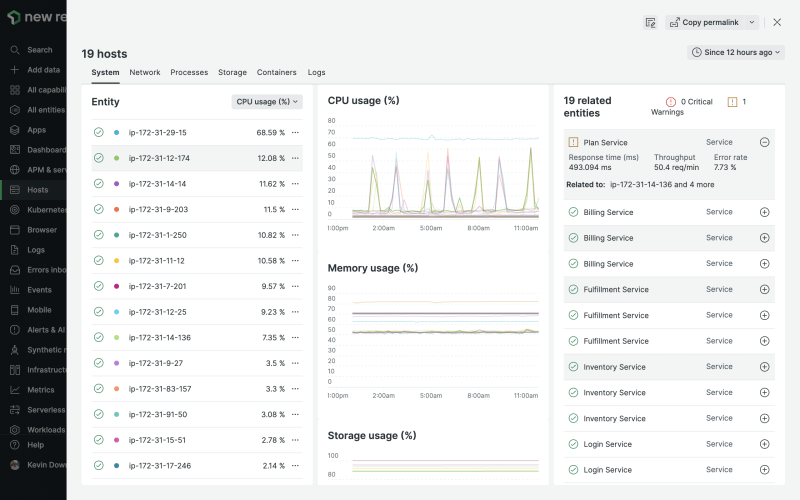
- System: Overview of your hosts’ performance
- Network: Bandwidth and error data about your network interfaces
- Processes: Data about CPU percentage, I/O bytes, and memory usage for individual or groups of processes
- Storage: Resources’ capacity and efficiency, including your devices’ overall utilization, disk usage, or I/O operations
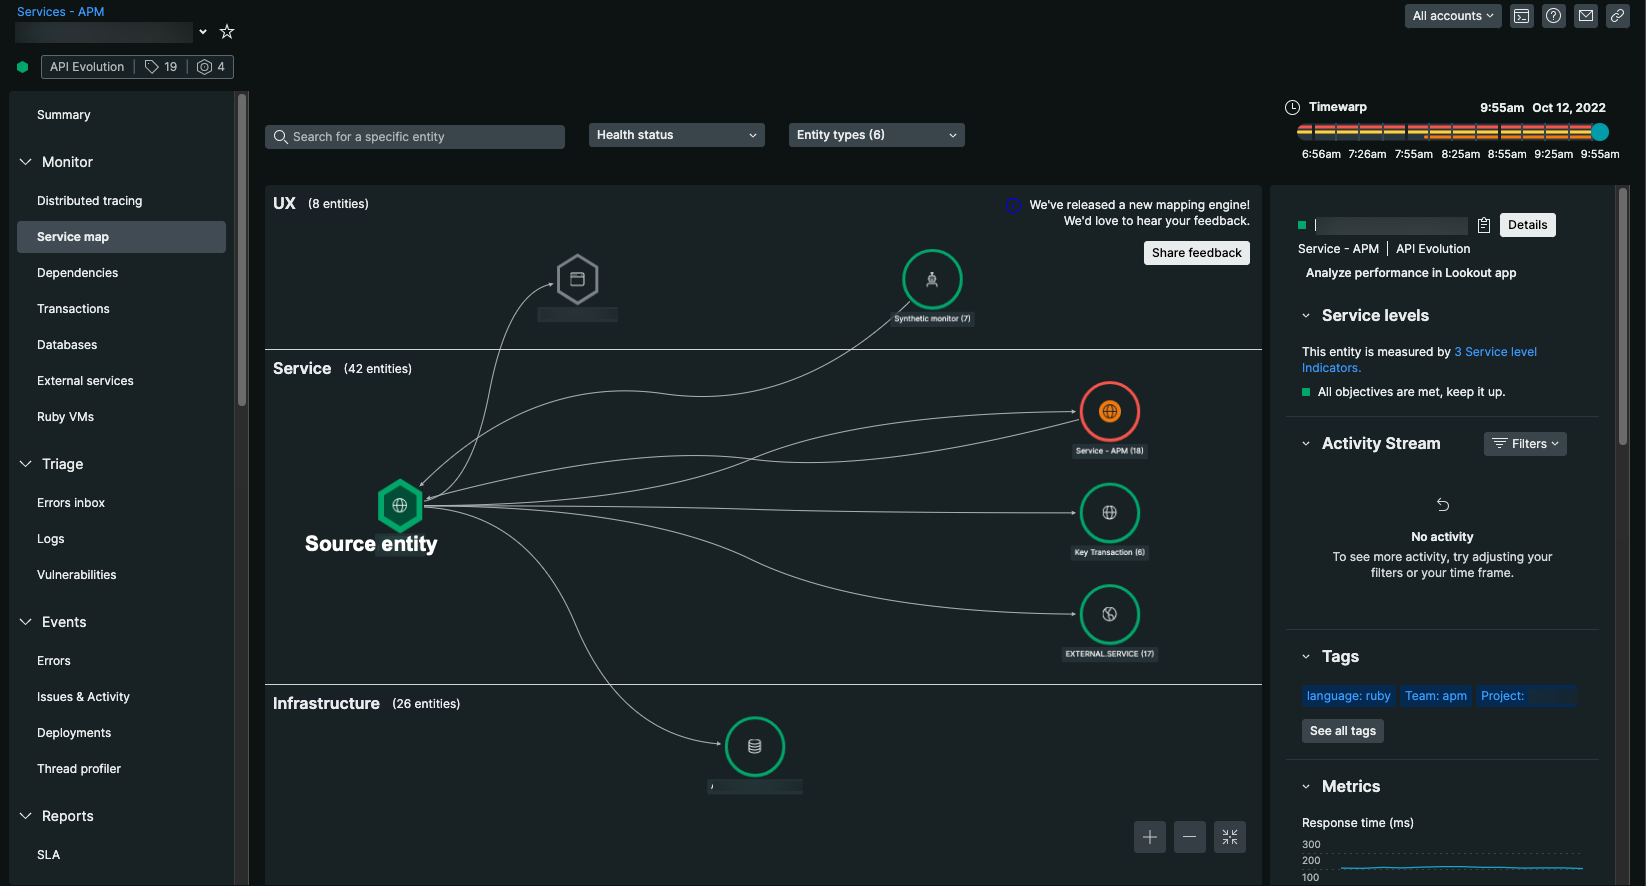
Automatic Service Map without mesh
Infrastructure monitoring
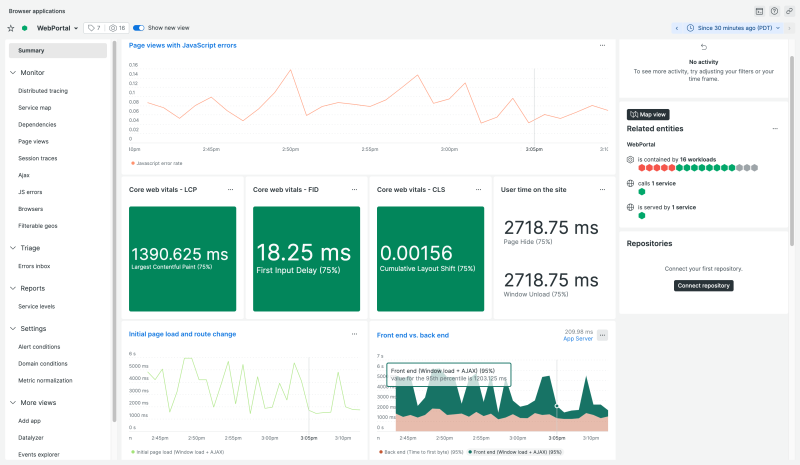
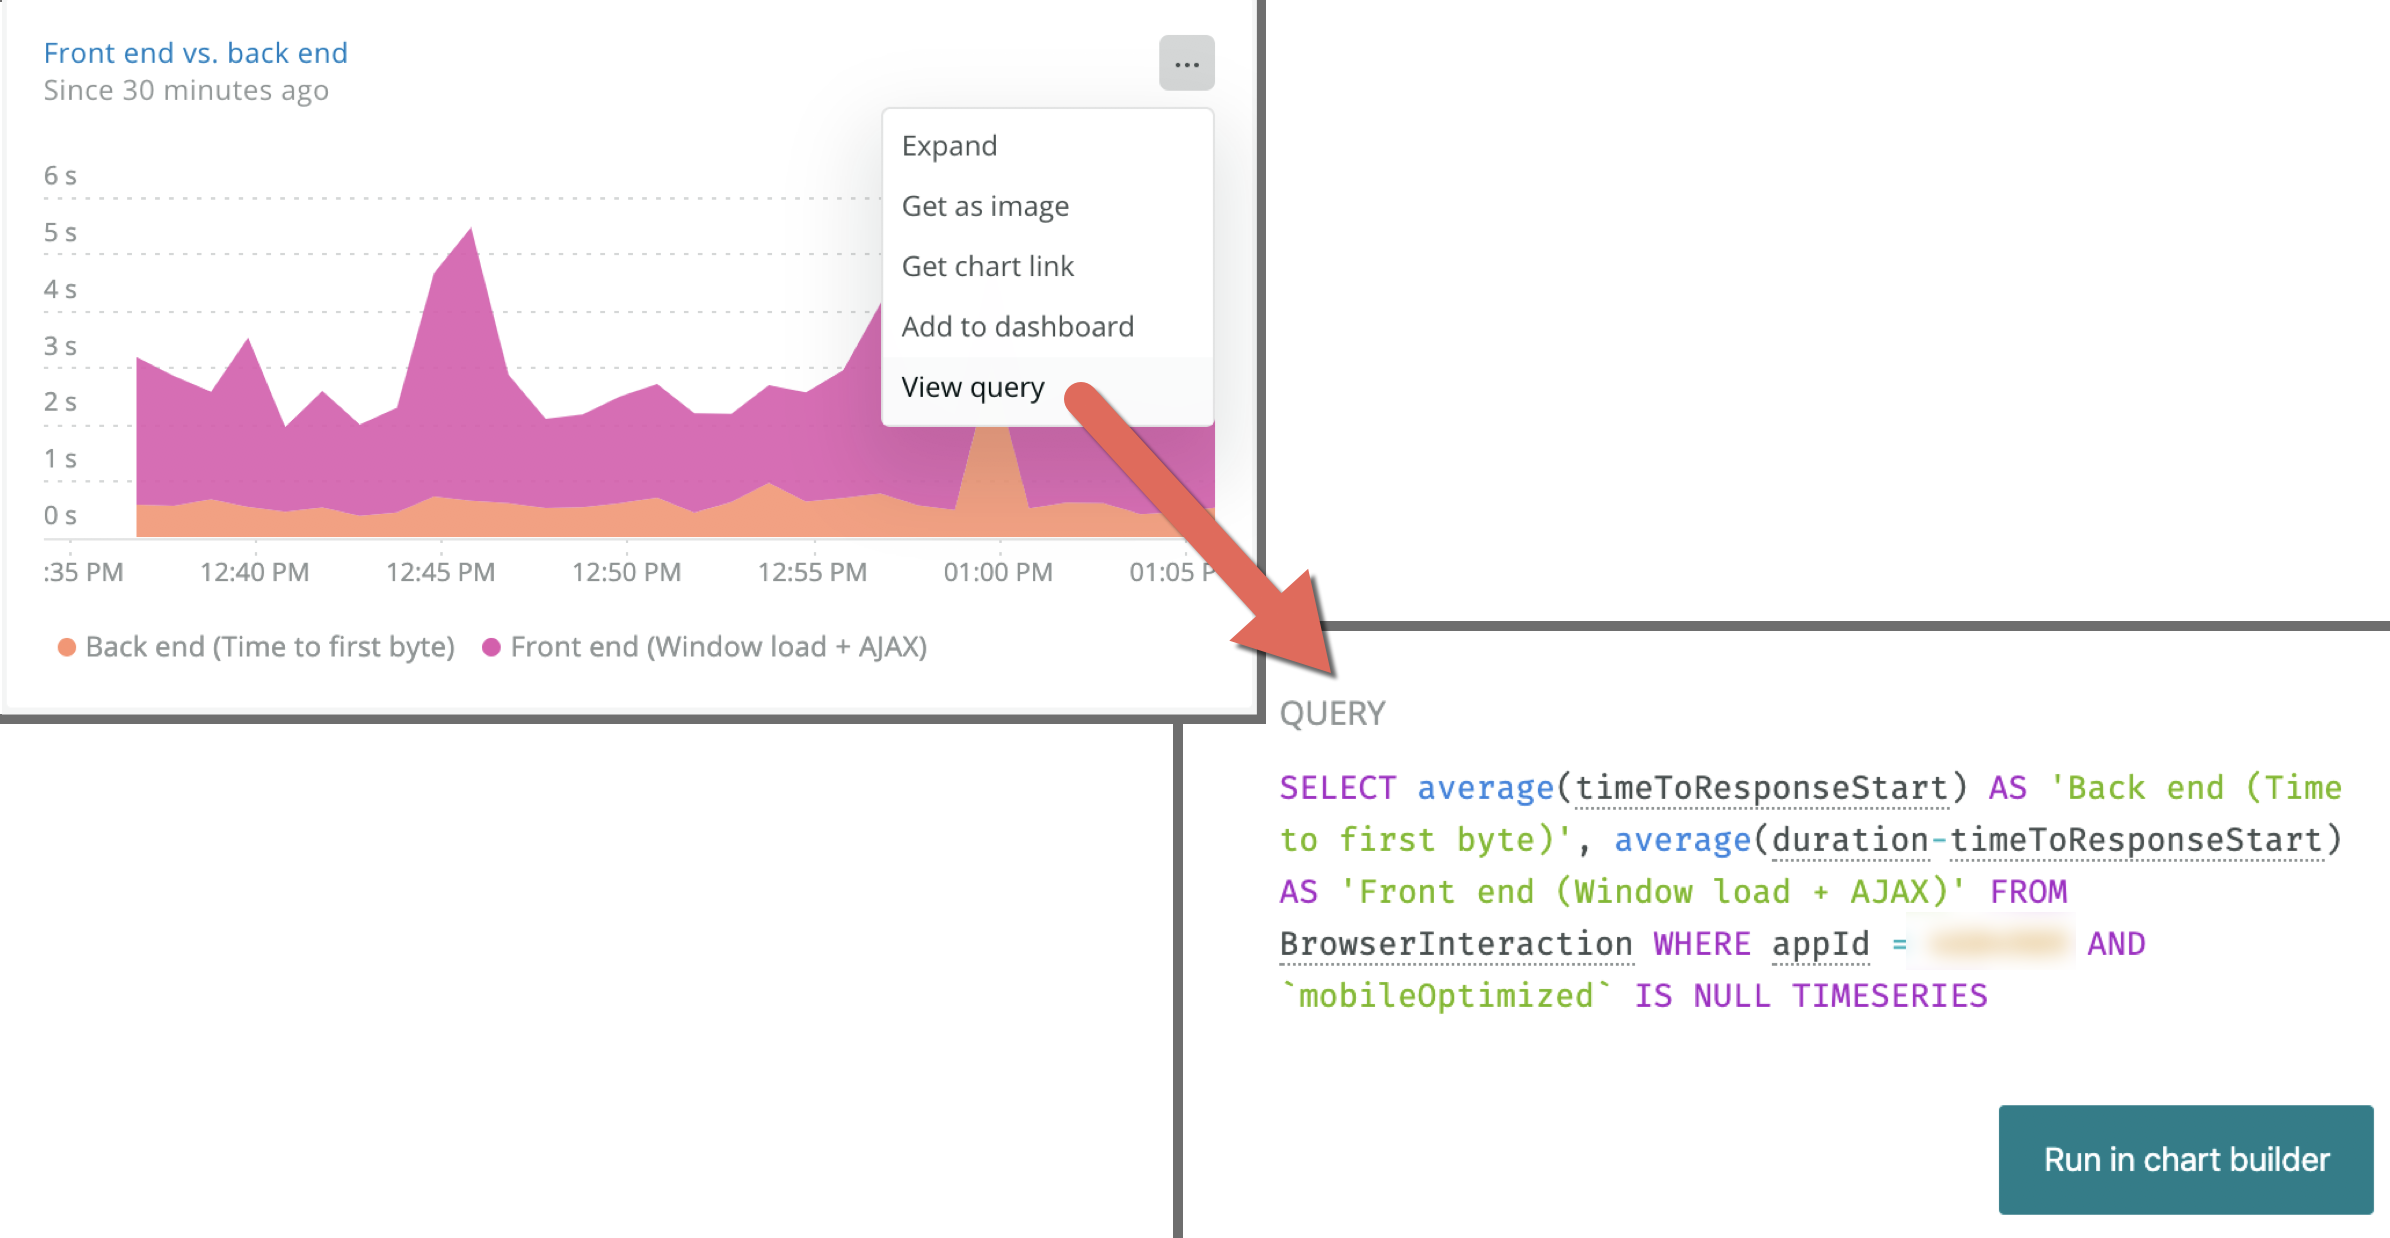
Browser monitoring (JS)
LowLevel transactions overview
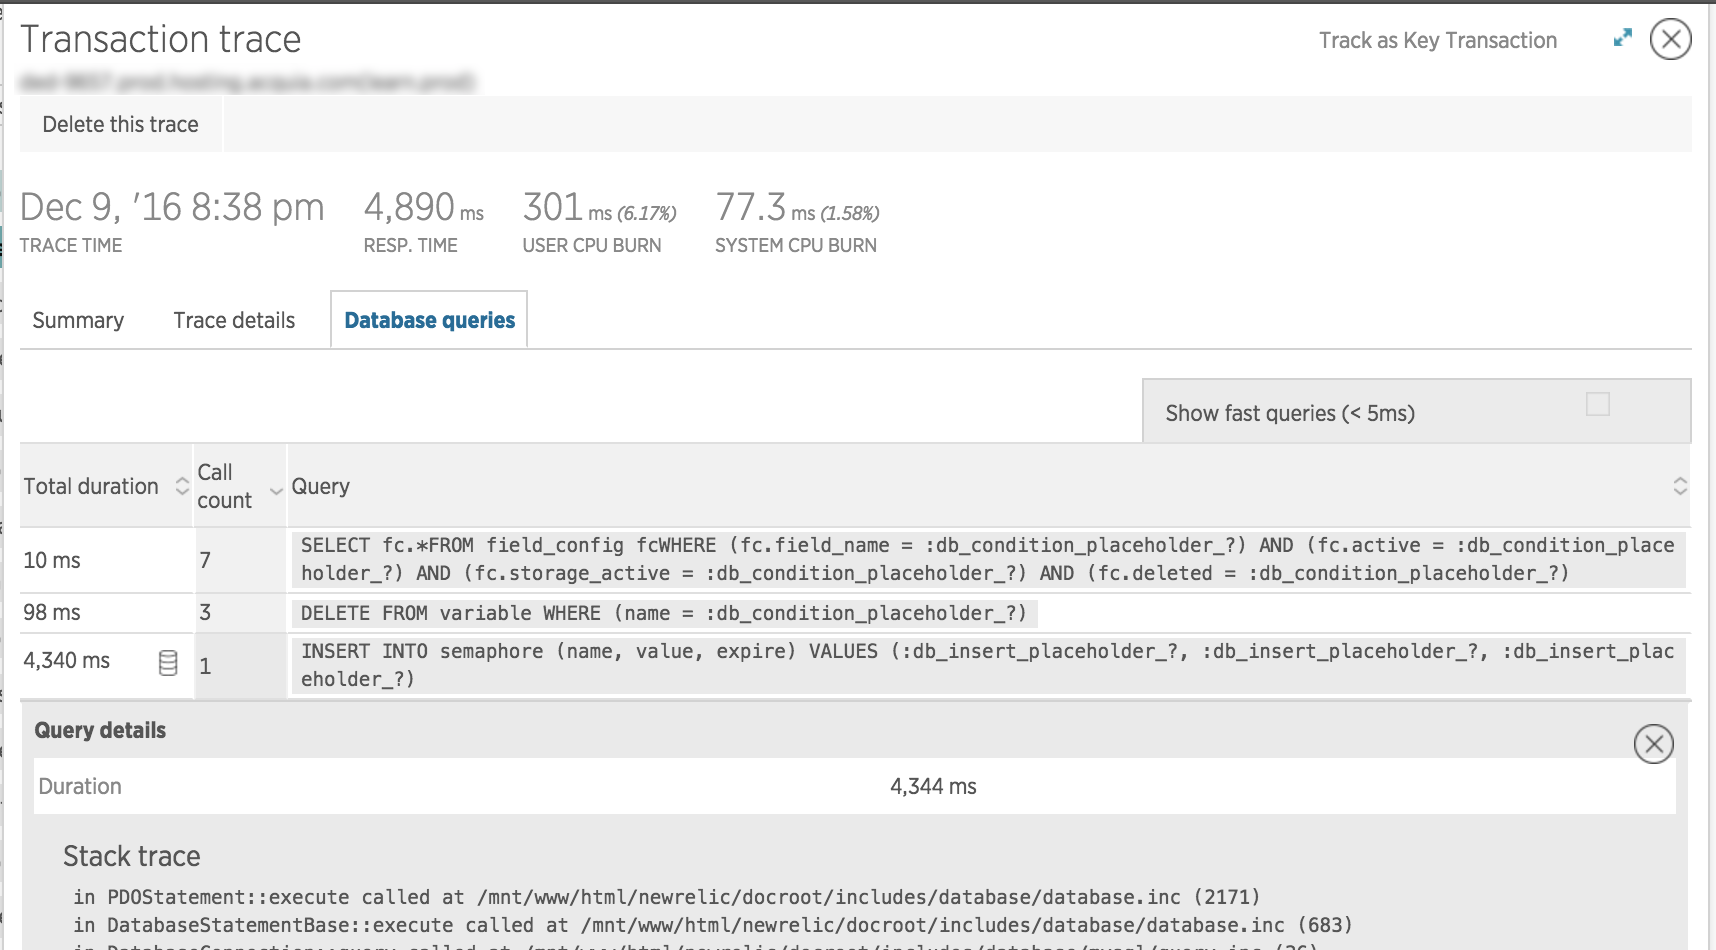
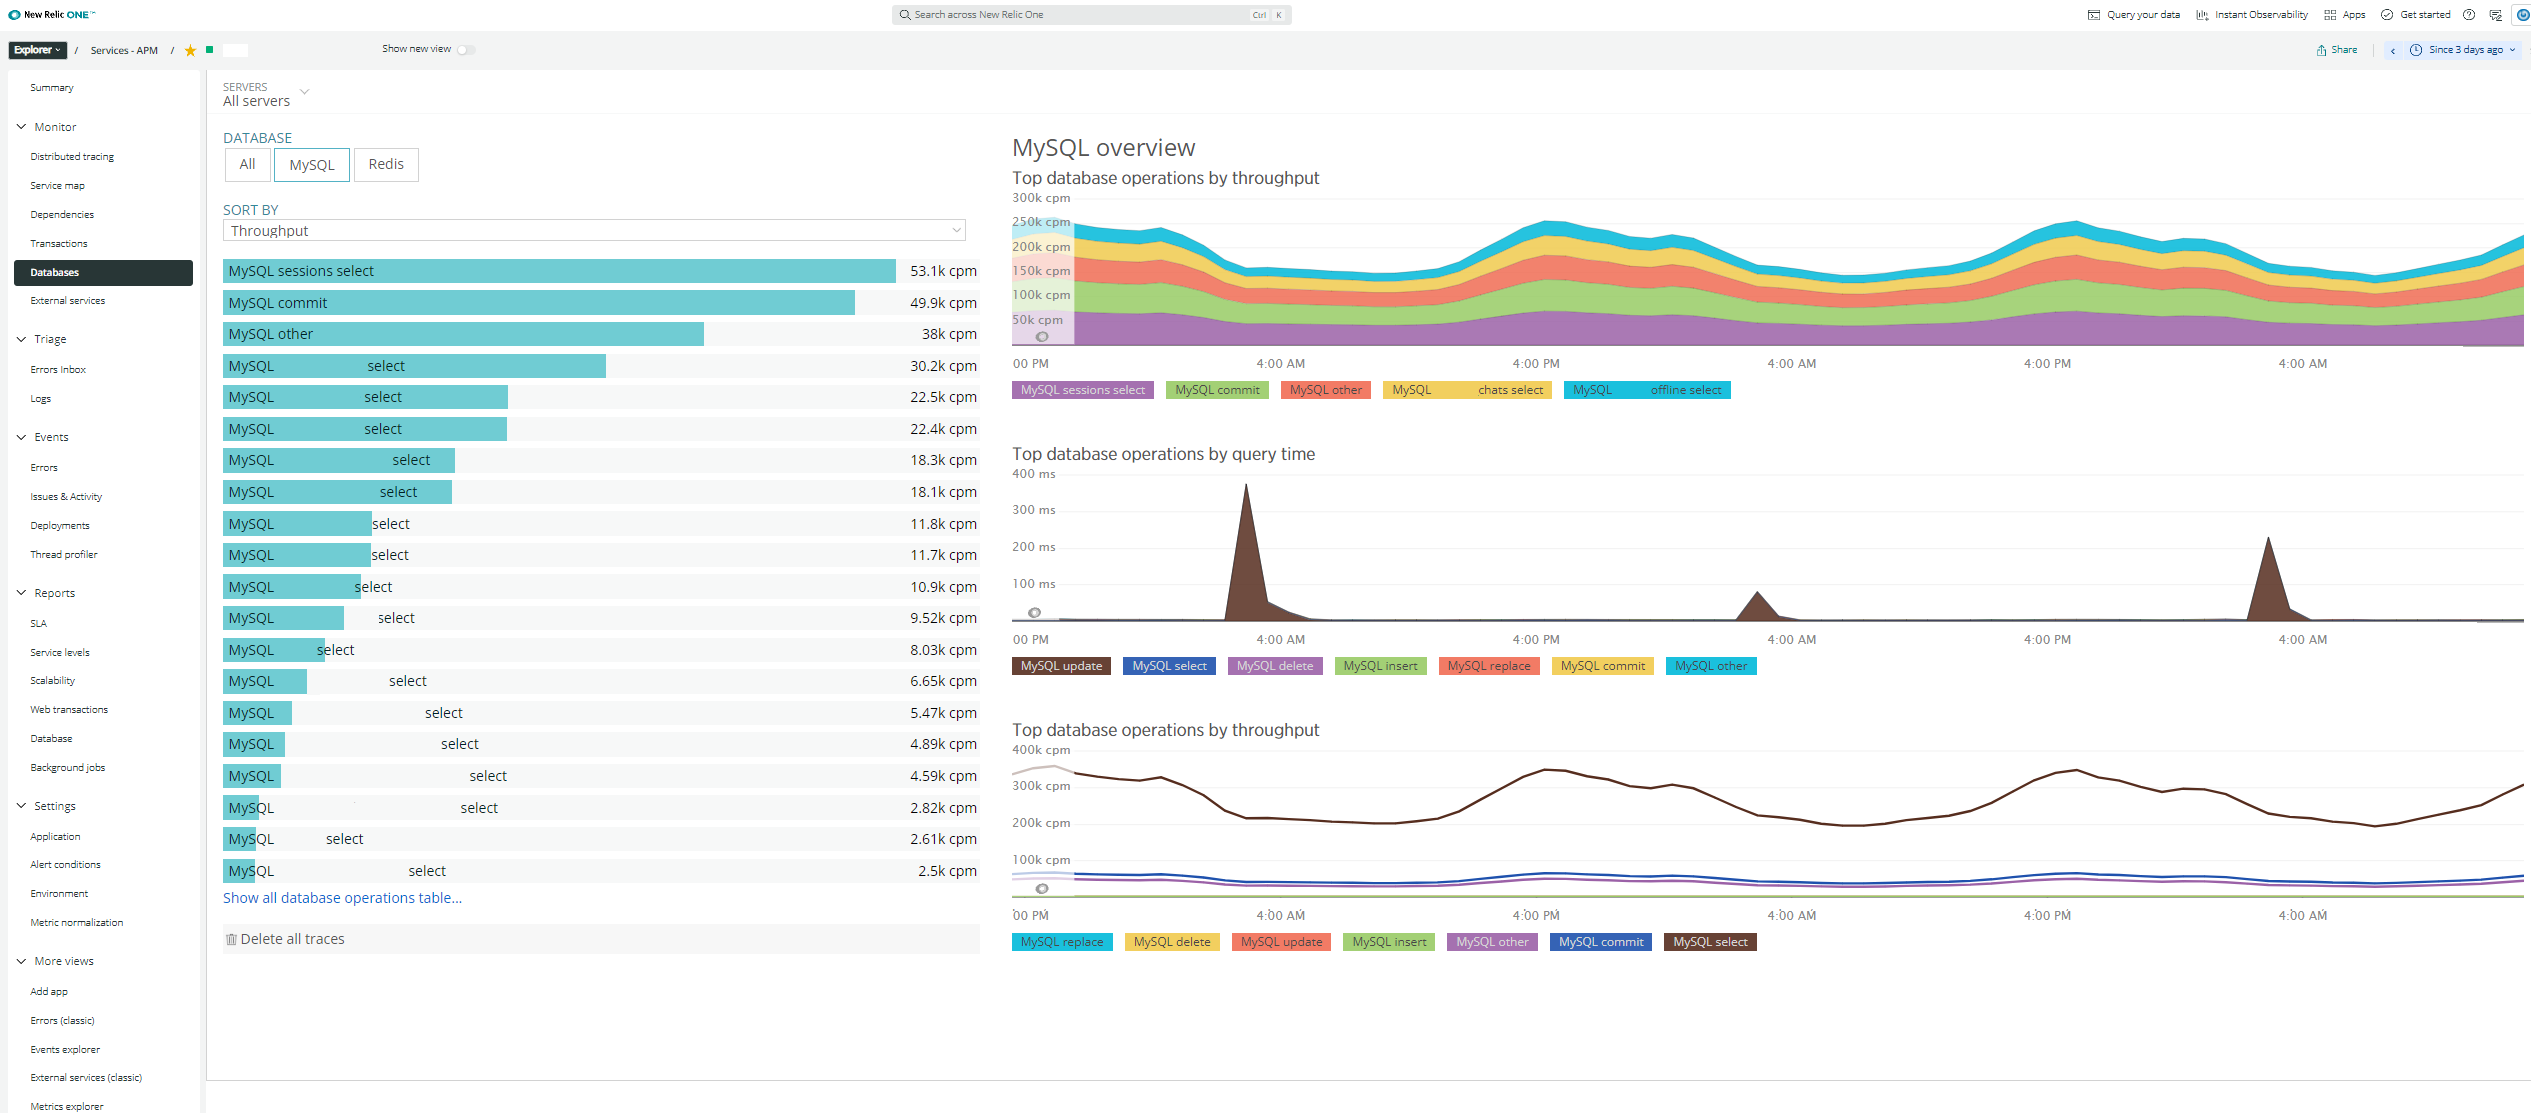
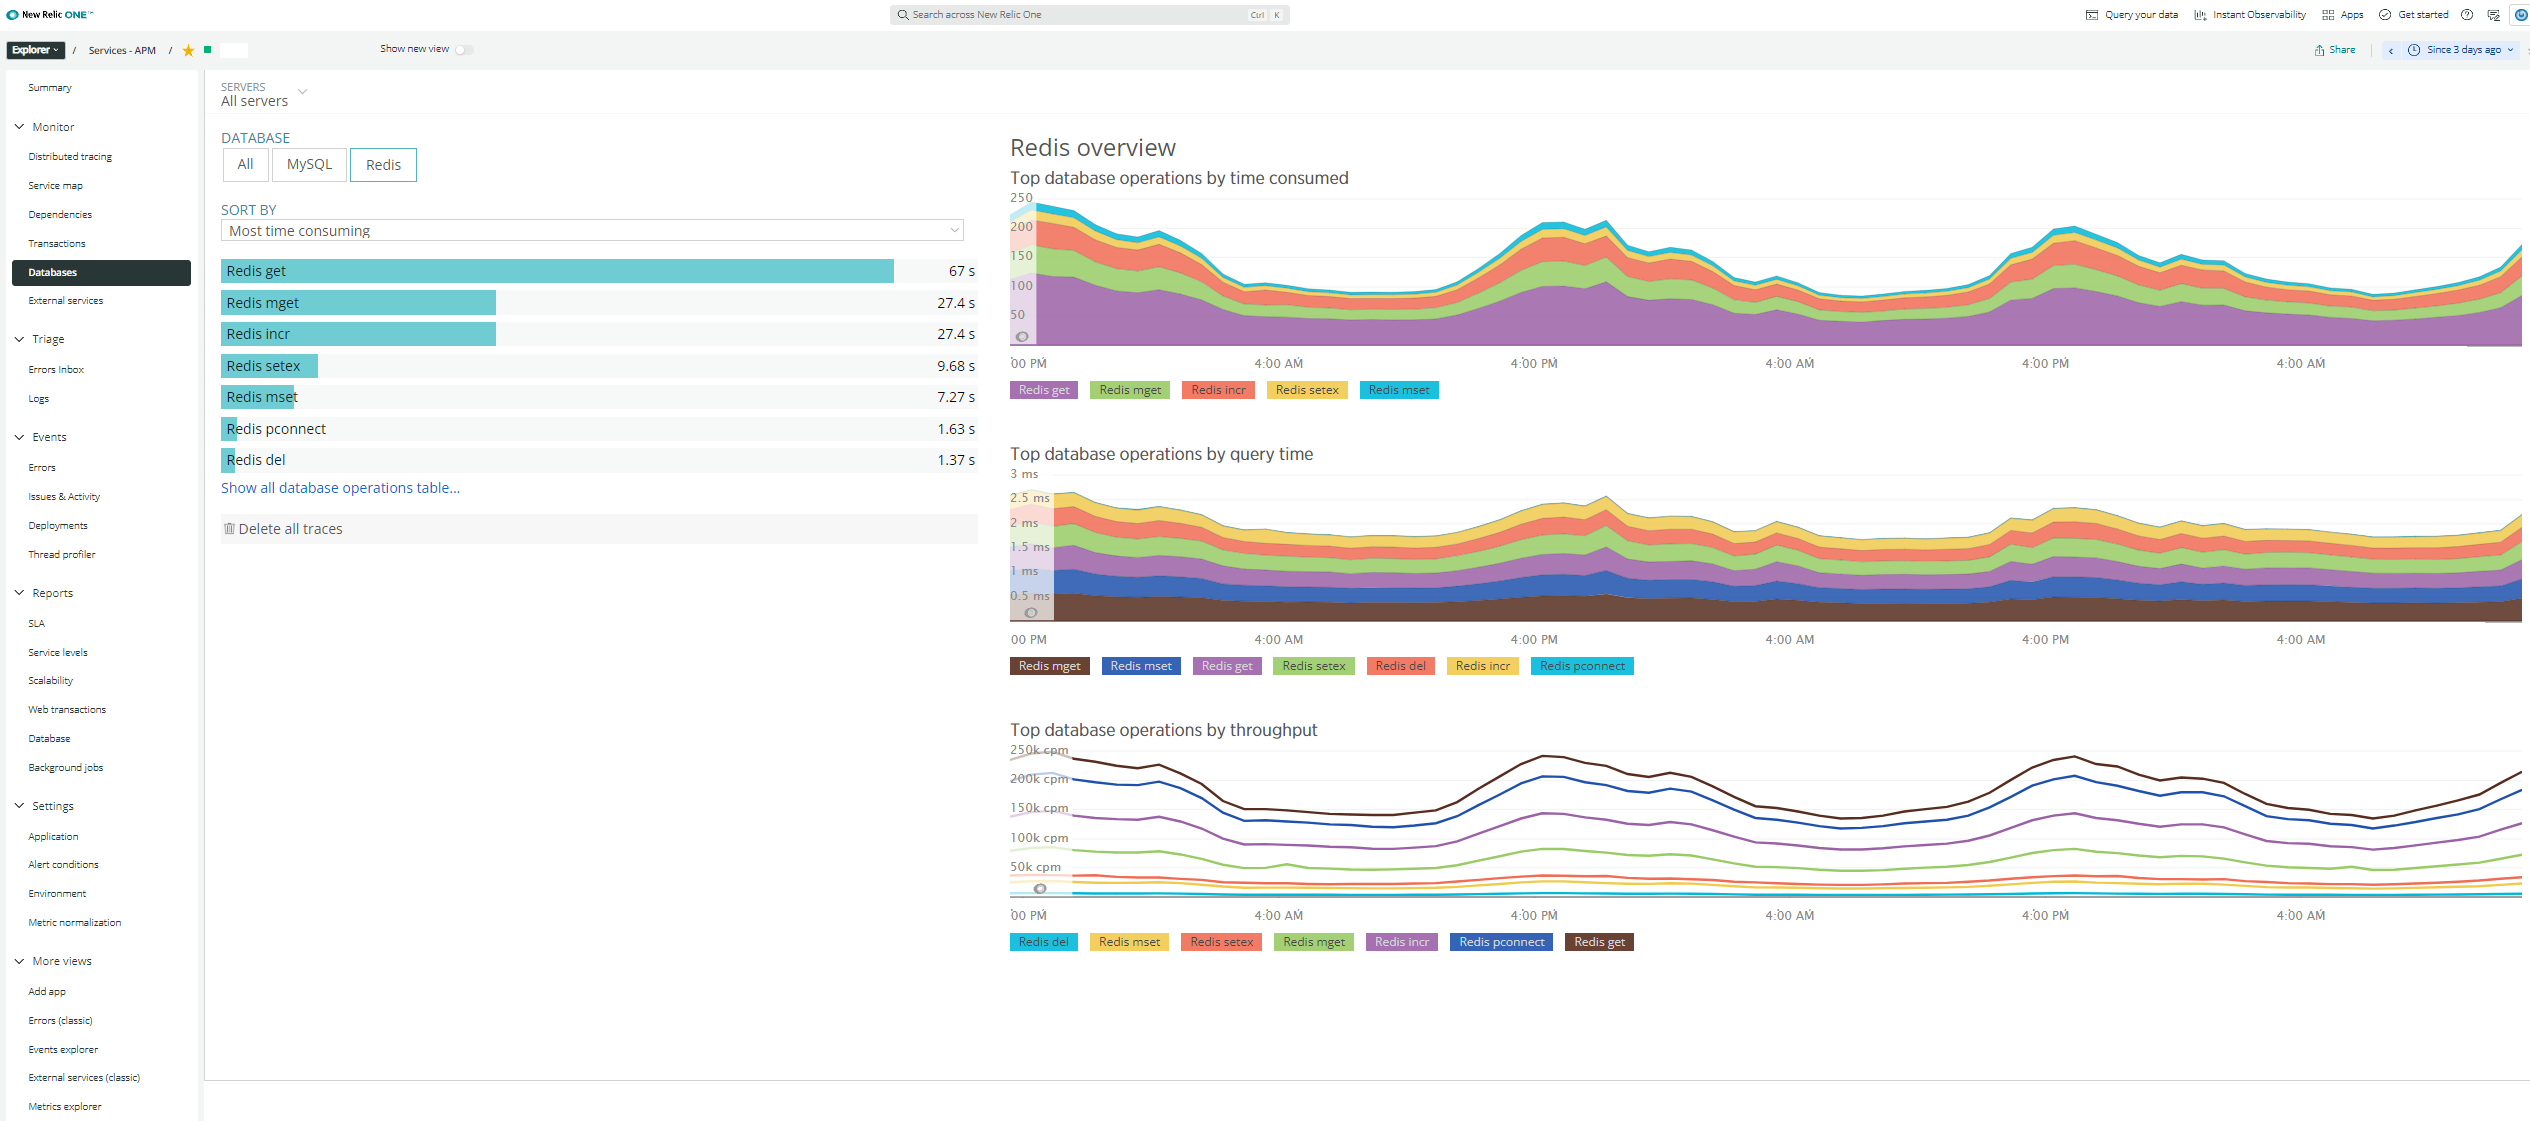
LowLevel Database, SQL & NoSQL overview
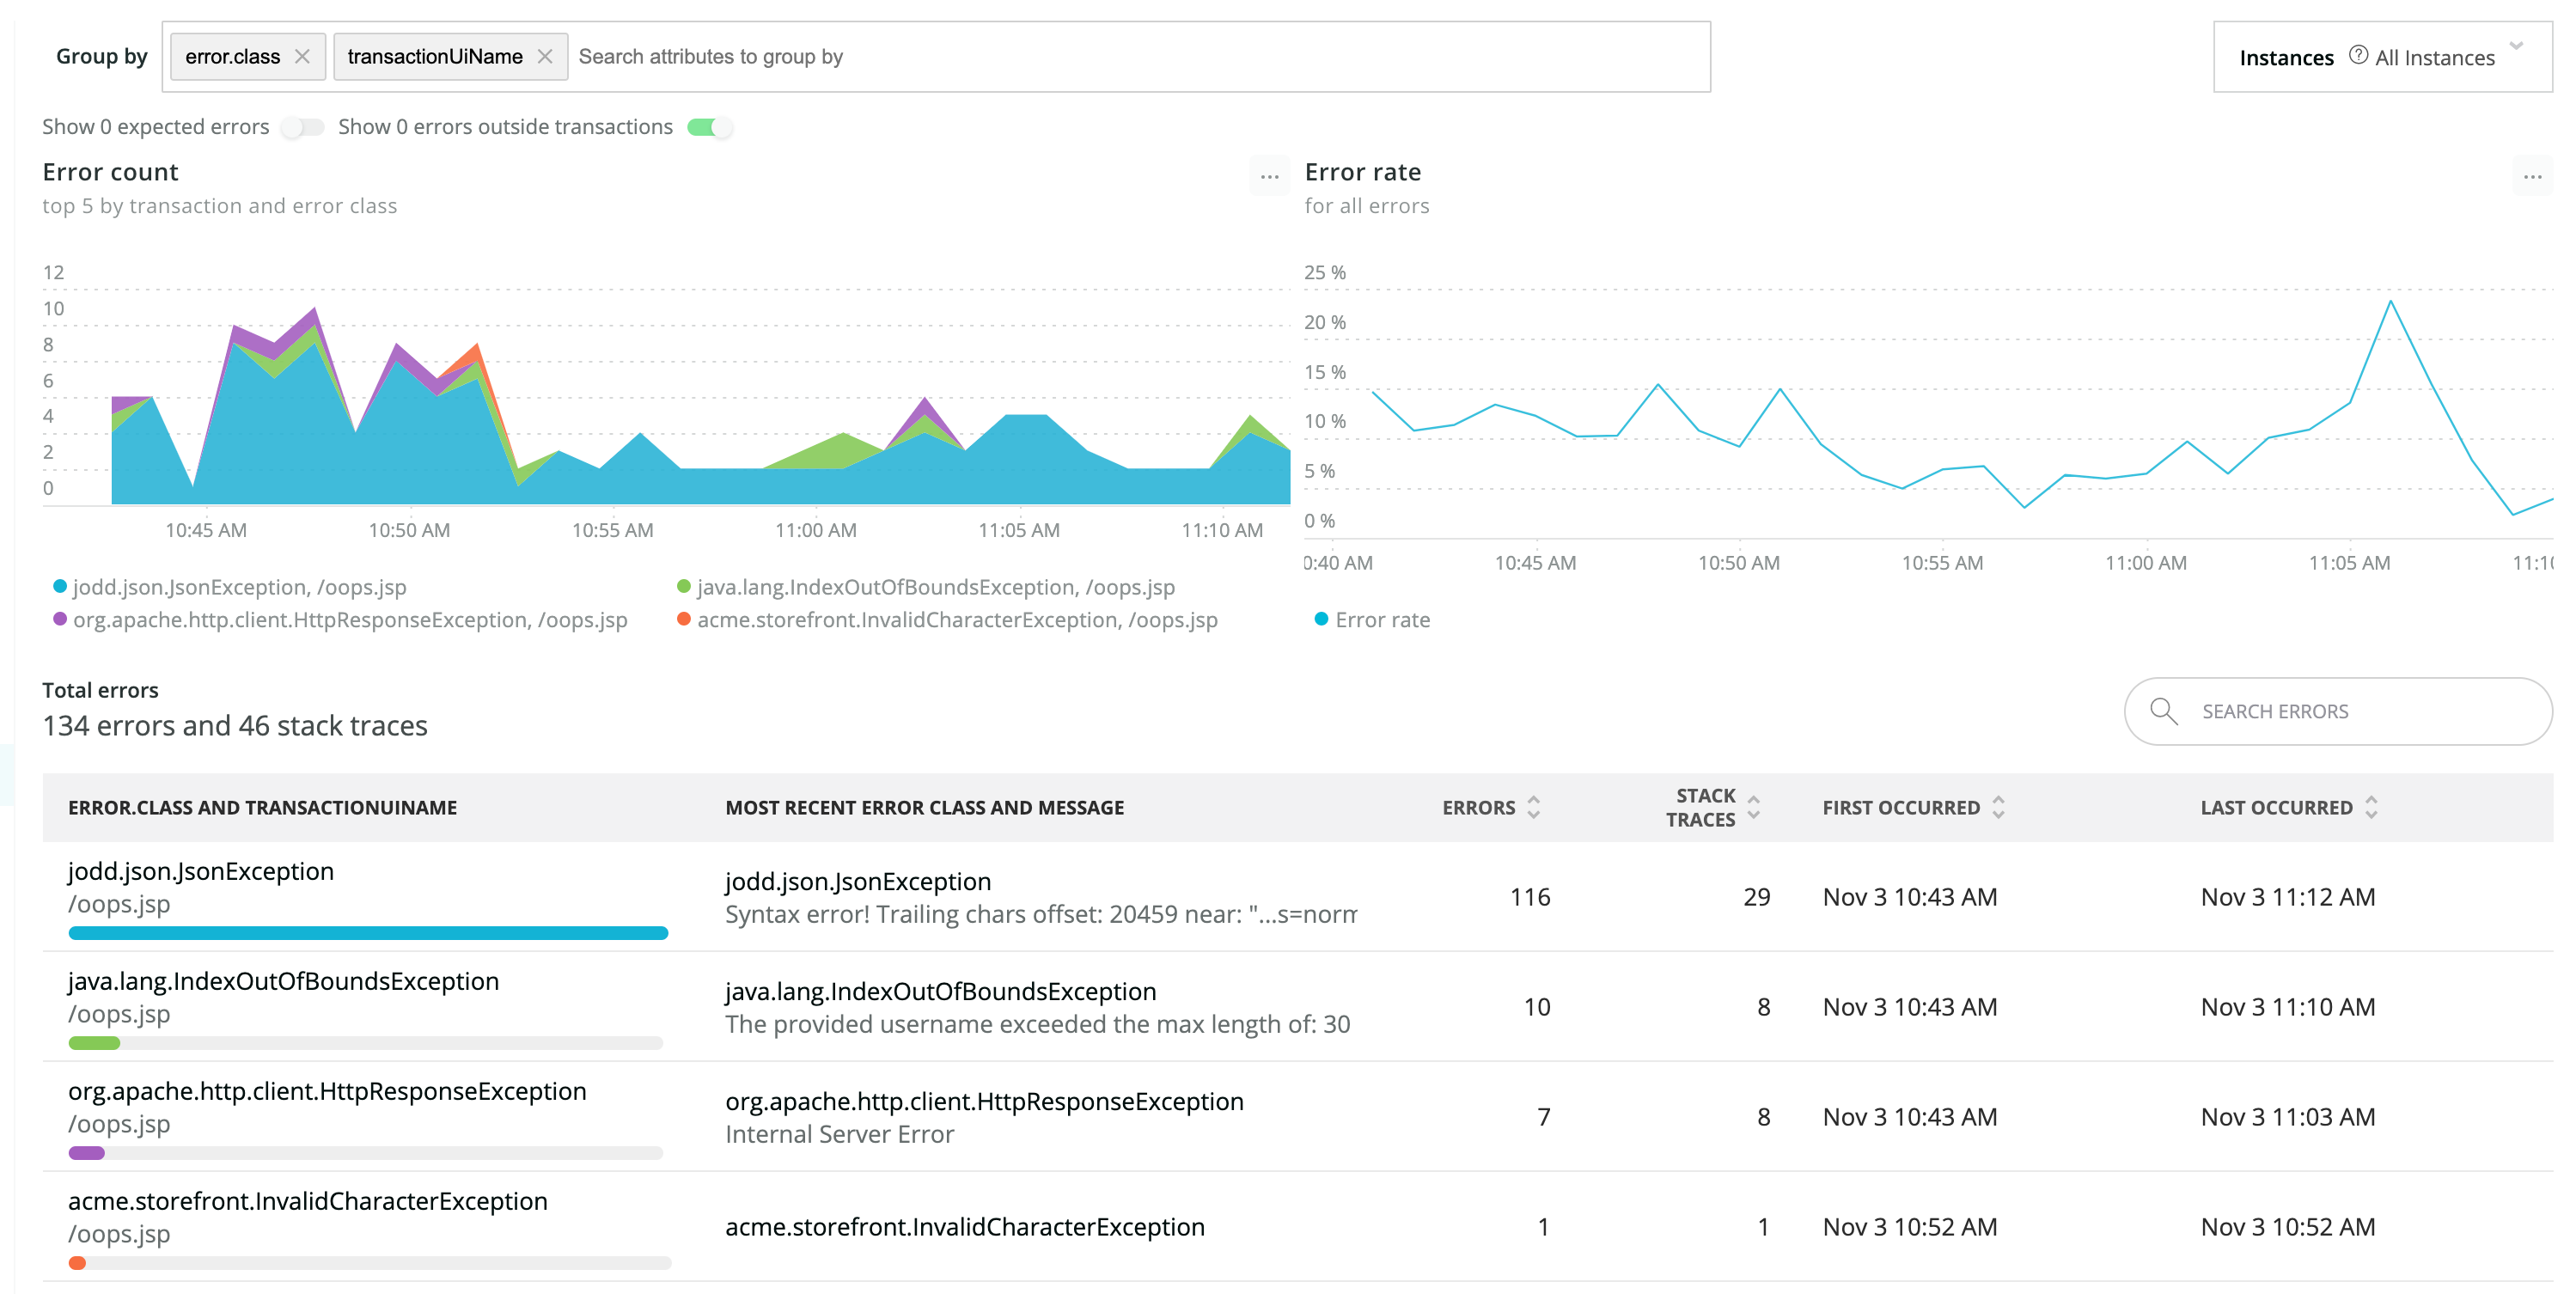
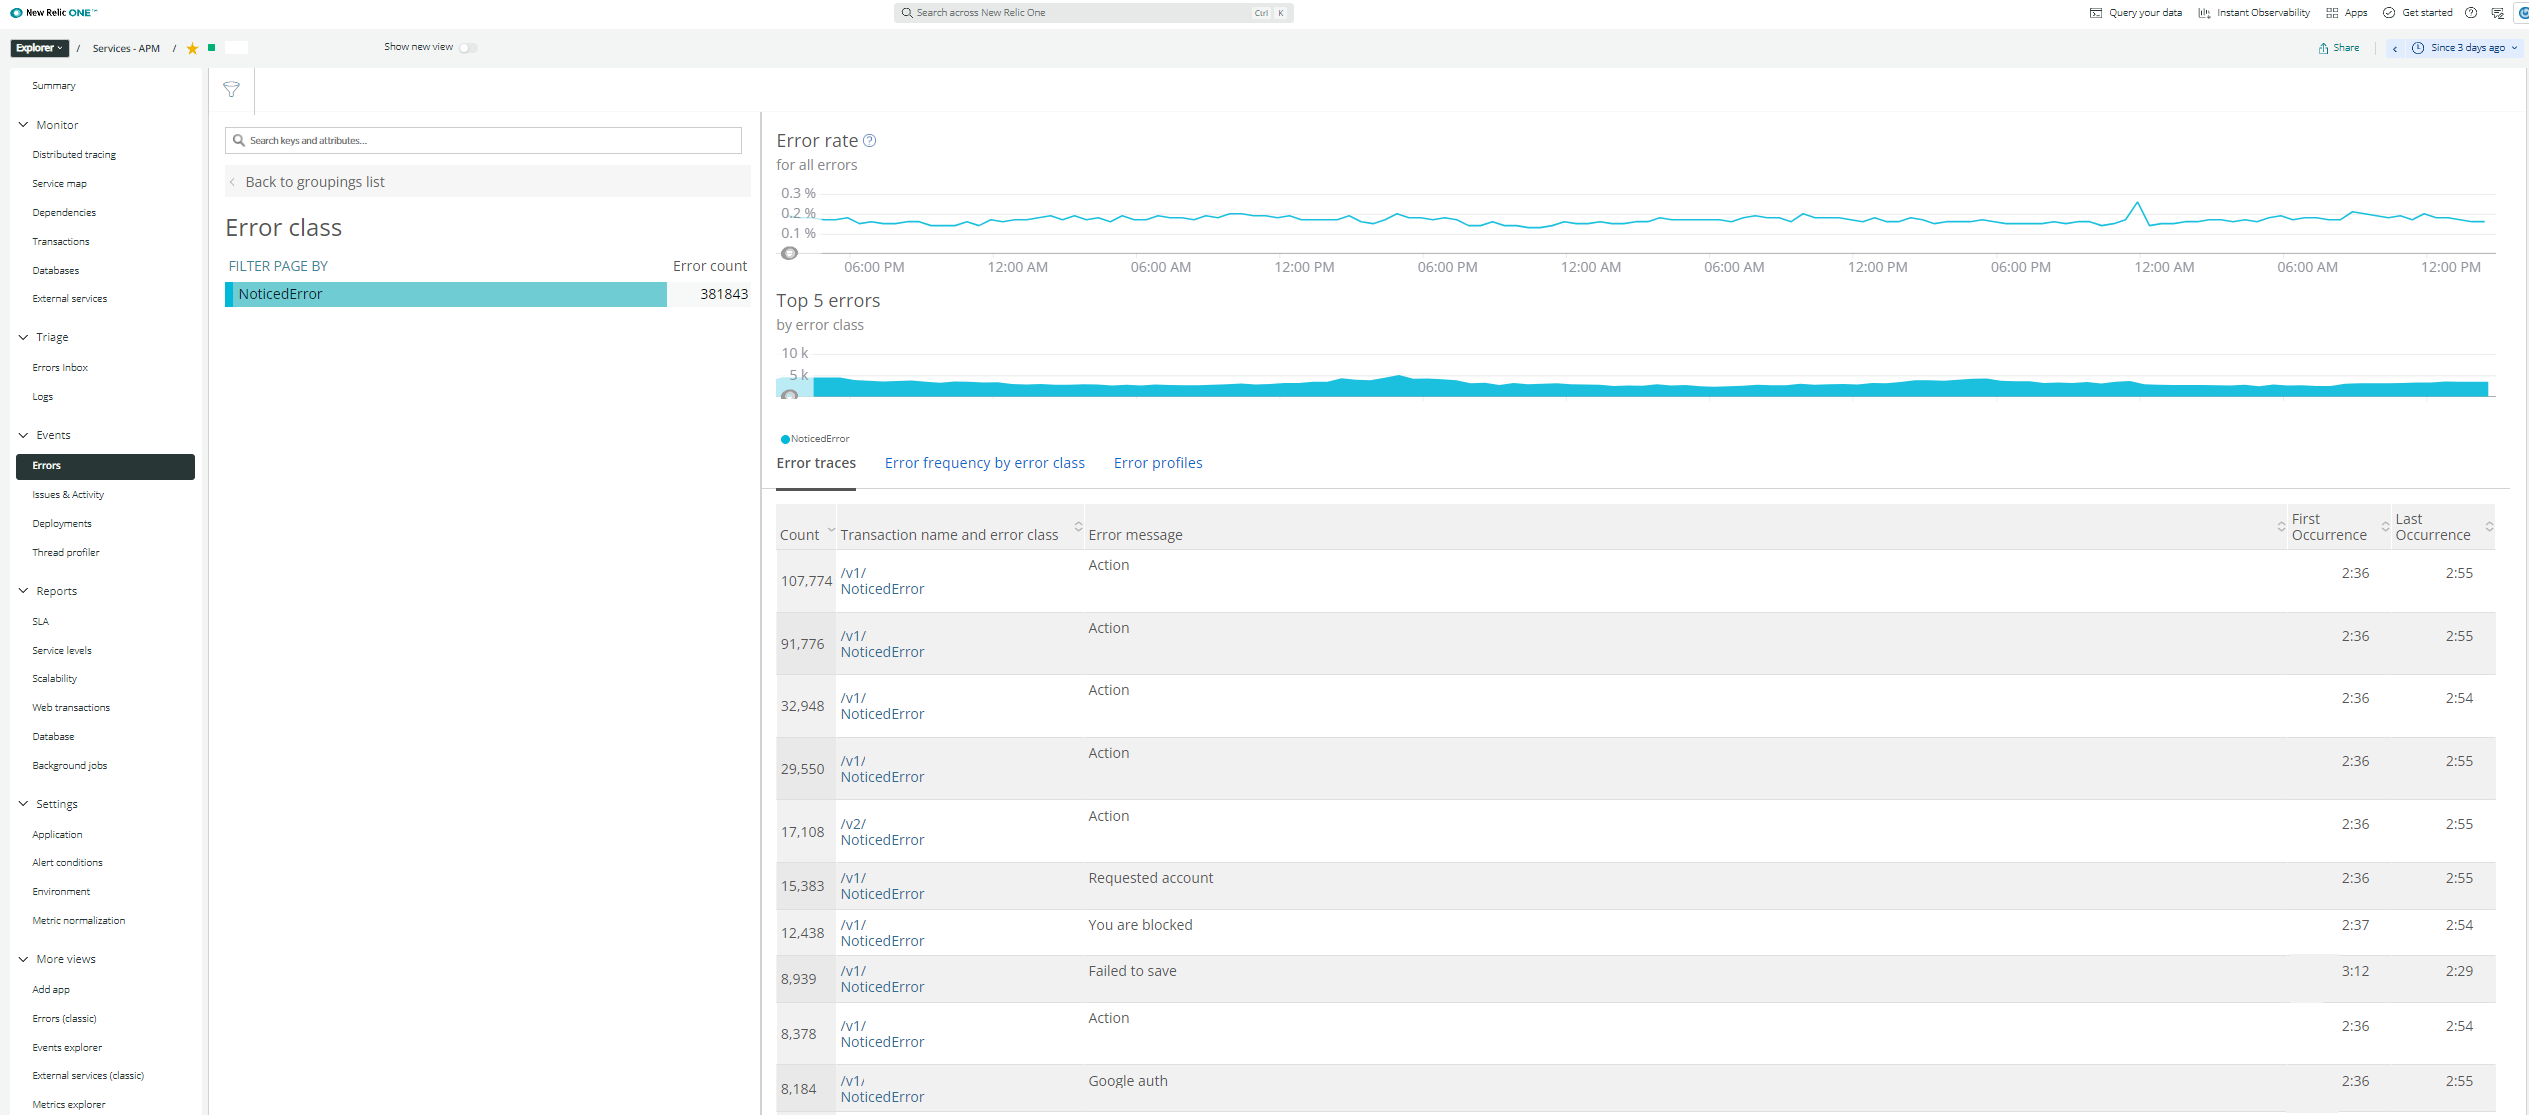
Error and Exception traces
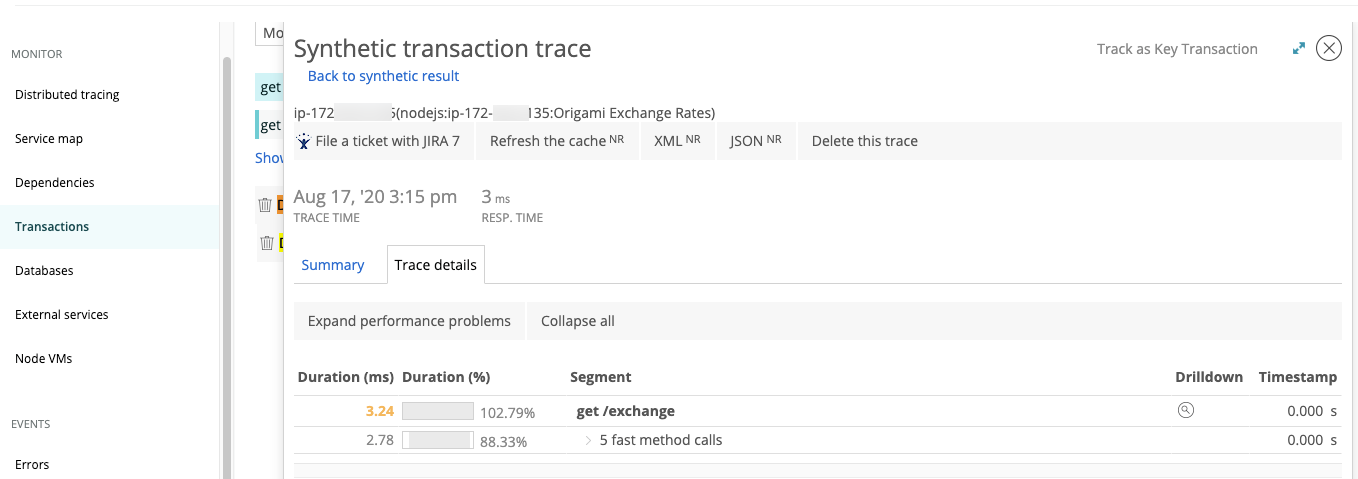
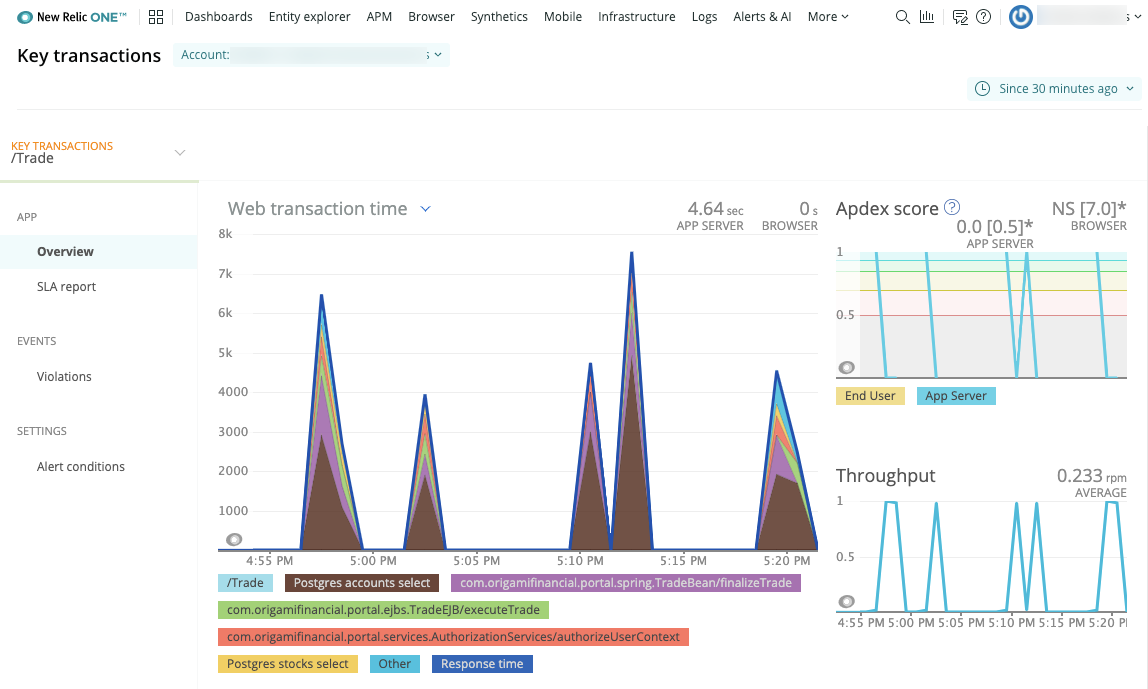
Key transactions vs All transactions traces
How to install
PHP agent consists of two basic components:
A PHP extension, which collects data from your application A local proxy daemon, which transmits the data to New Relic
- bonus Infrastructure agent (free!)
It comes in different mediums
- tar zip file with agent, same with infrastructure agent
- monitoring agent docker container
- infrastructure agent docker container
- php-fpm/apache/cli compatible
sudo apt-get install newrelic-php5
After that there are few settings to set in
- php.ini,
- fpm-www pool conf
- nginx fastcgi location
- user.ini script per directory
End result is ability to have multiple apps.
newrelic.appname = api1.myapp.com
newrelic.license = 123456
Verify installation with <?php phpinfo(); ?>
Start tracking transactions.
$name = 'v1/controller/action';
if (extension_loaded('newrelic')) {
    newrelic_name_transaction($name);
}
Advanced newrelic settings
NewRelic agent
;built-in support for symfony1,2,4,yii,zend,zend2,drupal ...
newrelic.framework

;enforce sending data over HTTPS,
;never send SQL query arguments "select * from names where id = ?", obfuscation before sending
;user-friendly HOSTNAME ie. api1.internal.myapp.com
newrelic.process_host.display_name
NewRelic collection daemon
;egress proxy to send traffic thru for security paranoid setups
newrelic.daemon.proxy
Logs collector
newrelic.application_logging.enabled = true
newrelic.application_logging.metrics.enabled = true
newrelic.application_logging.forwarding.enabled = true
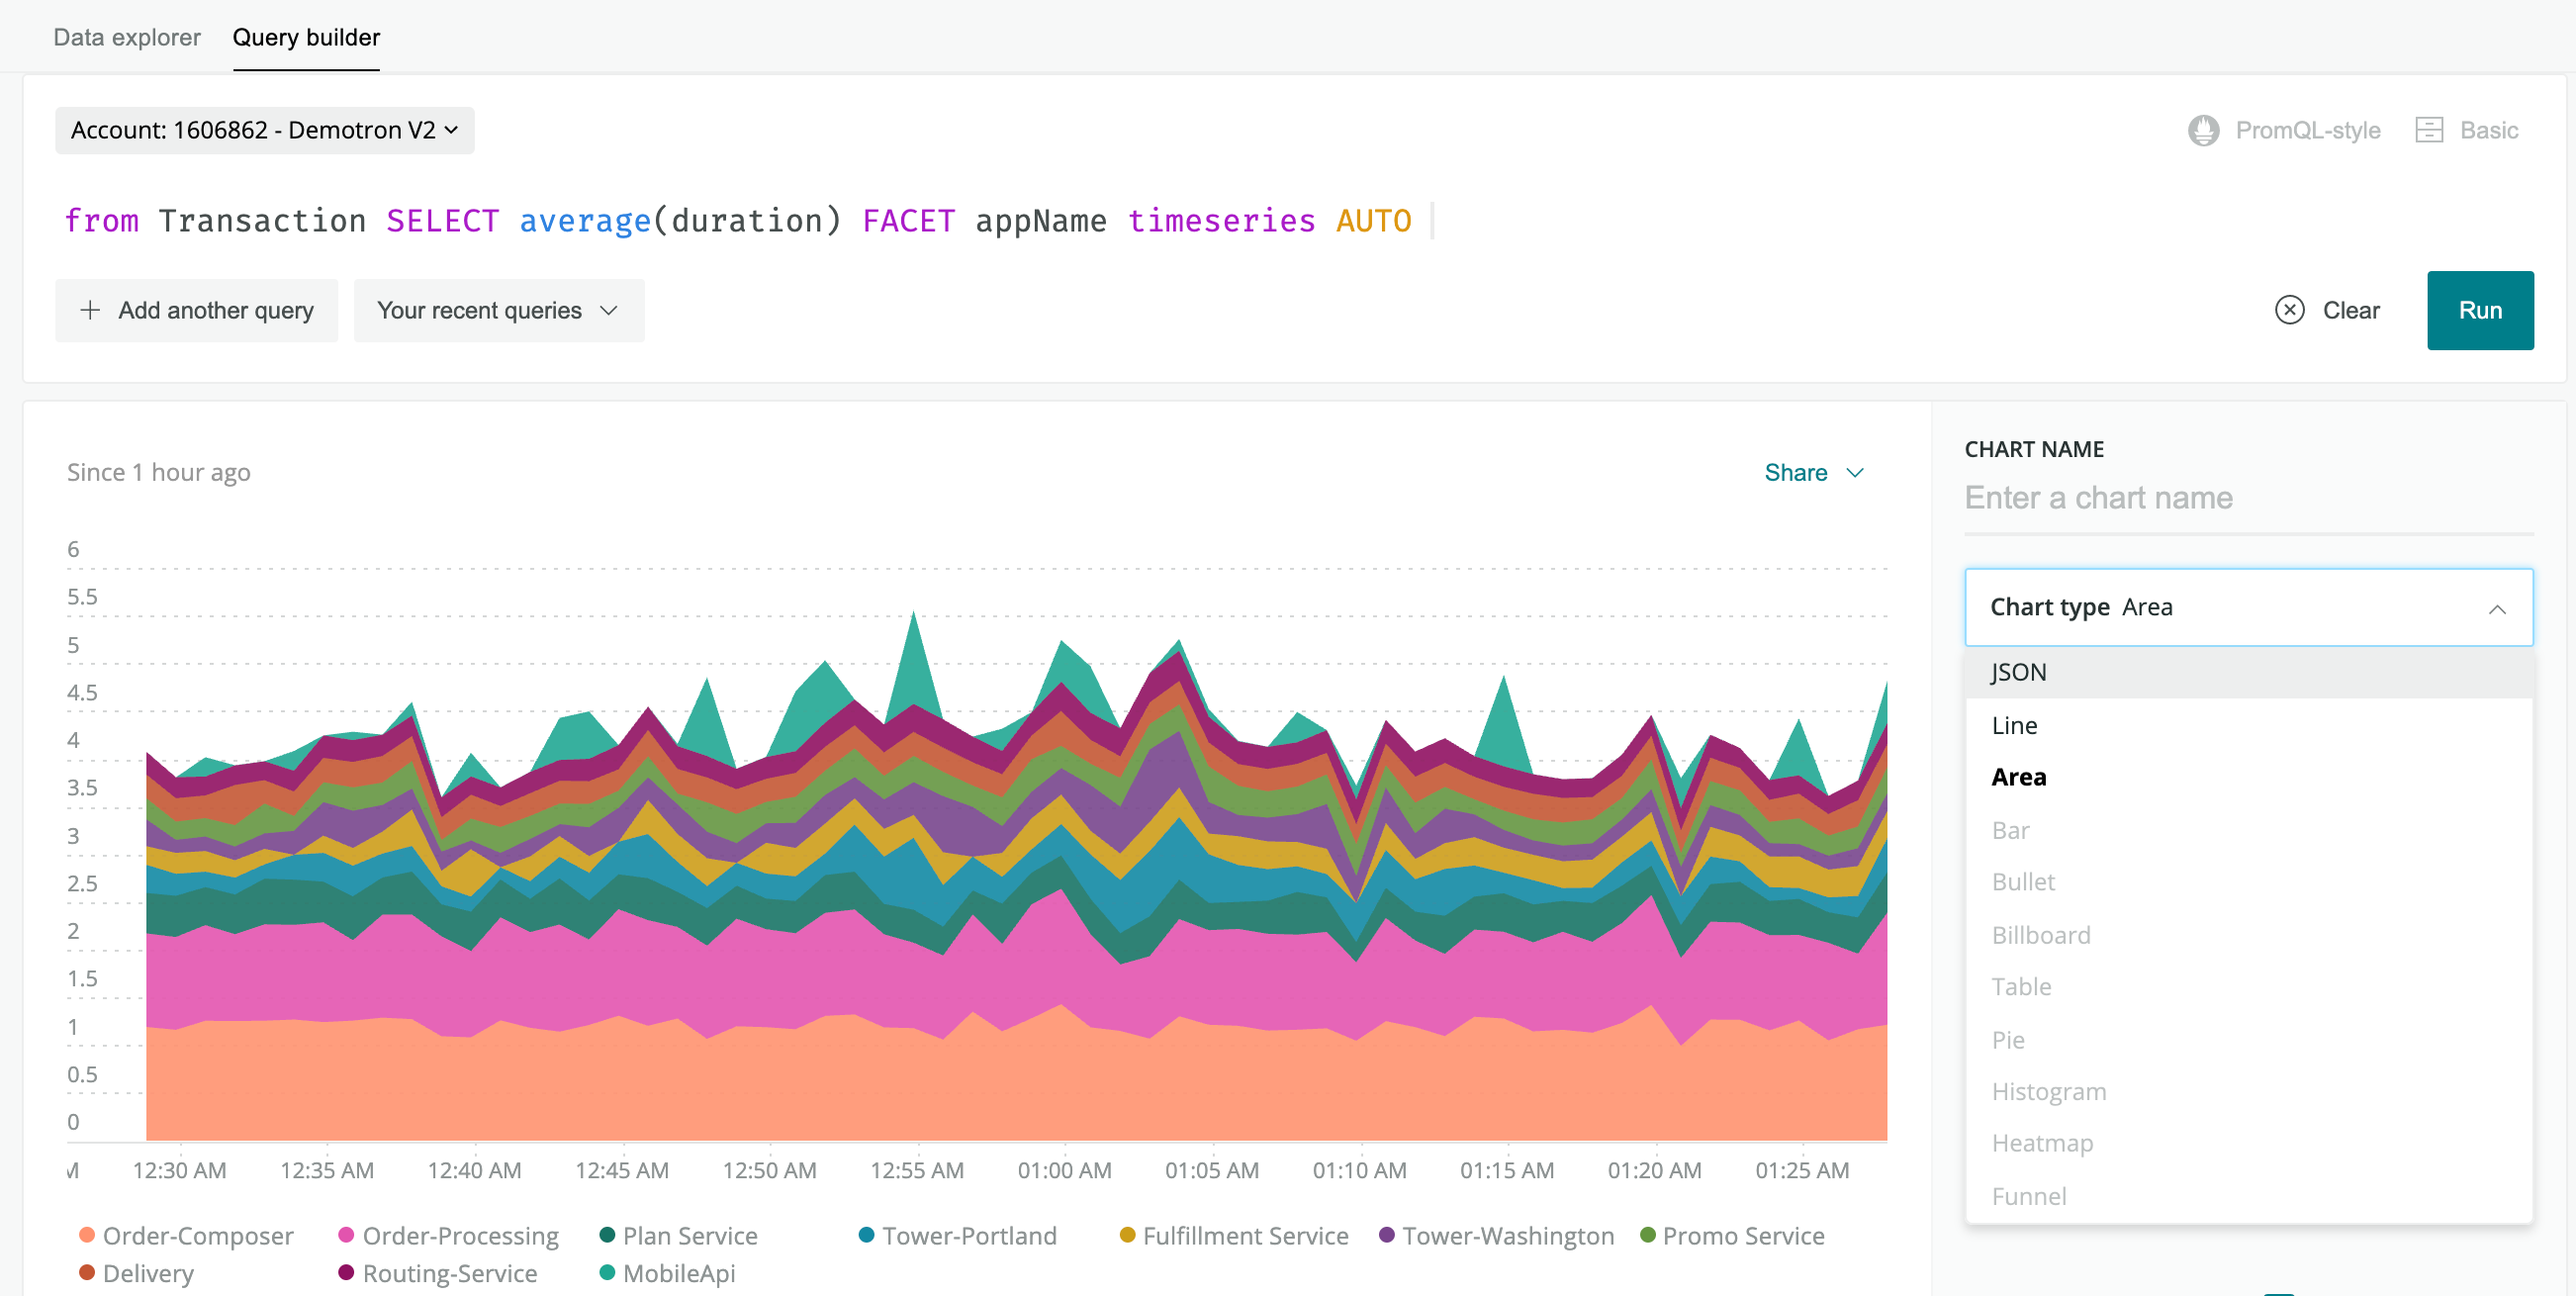
NewRelic NRQL - metrics query language
NewRelic offers access to RAW data they collect via language called [NRQL] (https://docs.newrelic.com/docs/query-your-data/nrql-new-relic-query-language/get-started/introduction-nrql-new-relics-query-language/) similar to PromQL of Prometheus
With NRQL you can
- create own dashboards
- create own metrics (see prometheus recording rules)
- create own alerts (see prometheus alerts)
Certification and 3rd party integrations
- AWS Partner
- Kubernetes Monitoring
- Synthetics (external healthchecks)
- 500+ Marketplace integrations
- OpenTelemetry
- Golang
- Linux, AWS ECS, Apple MacOS
- MySQL
- Nginx
- RabbitMQ
- Redis
- GCP services
- AWS services
- Prometheus
- JIRA/EMAIL/SLACK and generic WebHooks
More examples
- NewRelic APM - PHP summary
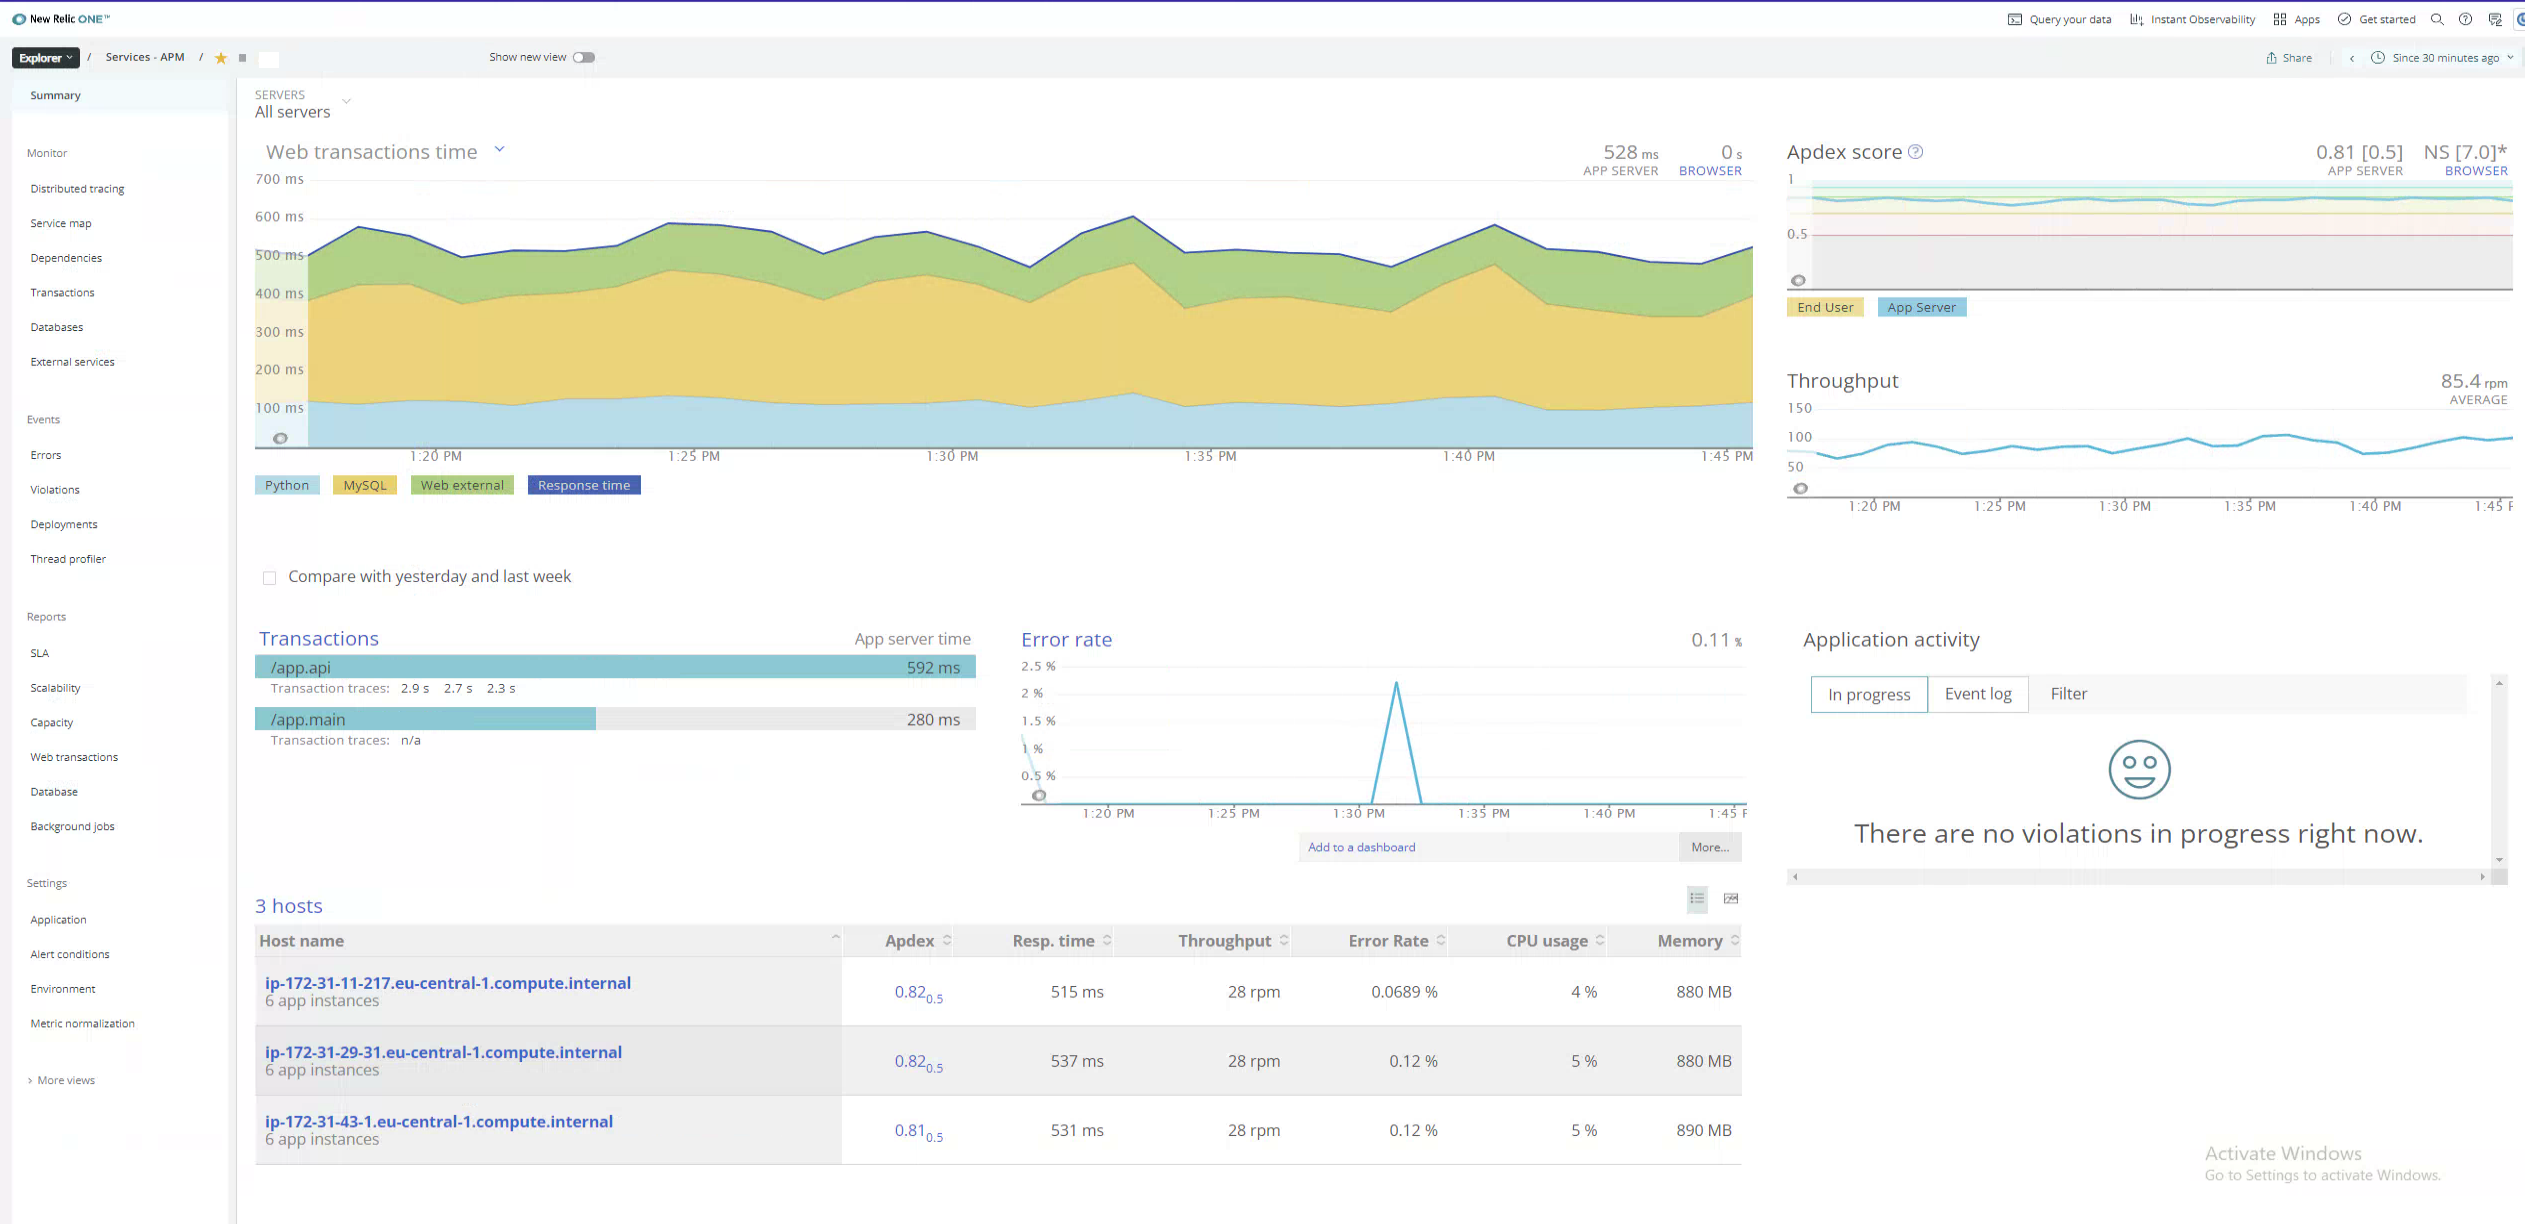
- NewRelic APM - PHP summary spike
- NewRelic APM - Python summary
- NewRelic APM - DB MySQL
- NewRelic APM - Redis
- NewRelic APM - Errors
- NewRelic Event - Demo M.E.L.T
- NewRelic MELT 101
Update Oct 20202
- Initial release
https://moar.sshilko.com/2022/10/22/Newrelic-PHP