NewRelic manual distributed tracing via API
Instrumenting PHP application for observability without changes to runtime.
Introduction
NewRelic, Tracing API, Distributed tracing and OpenTelemetry.
It is challenging to improve observability without ability to install proper PHP auto instrumentation agent.
- No access to application runtime
- No access to container runtime
- No access to host OS
Possible solutions
1 OpenTelemetry
- Instrument application with OpenTelemetry
- Automatic instrumentation relies on OpenTelemetry PHP extension
- Manual instrumentation involves installing SDK and adding OpenTelemetry API calls inside application code
Making changes to runtime is not possible. Installing SDK for manual instrumentation is complex and might introduce unexpected side-effects.
2 NewRelic APM
- Instrument application with NewRelic APM
- Automatic instrumentation relies on PHP extension
- Manual instrumentation is not possible
Making changes to runtime is not possible. In addition to PHP extension, installation of collector “Agent”, a separate process is required, not possible.
3 Manual instrumentation and telemetry agent like Zipkin or Jaeger
- Solutions rely on OpenTelemetry implementation which is not possible
- Solutions require actual Zipkin/Jaeger application to run alongside main application
4 NewRelic and manual instrumentation with NewRelic Trace API
NewRelic offers ability to send OpenTelemetry and proprietary format to their Trace API as JSON via HTTP.
The Trace API is one way that New Relic collects distributed tracing data. We have some tracing tools that report data via this API (Infinite Tracing, our open source integrations, and our Telemetry SDKs), or you can use the API directly to create your own tracing implementation.
Reasons to use the Trace API:
- Ability to send 100% of your trace data
- Use your own sampling
- You have your own custom distributed tracing tool and want to see that data in New Relic without changing your instrumentation.
- You have a tool that emits tracing data but that requires a backend for trace storage.
- You want to report distributed tracing data to New Relic without the use of our installed solutions.
- Ability to use GraphQL-based NerdGraph API to programmatically query your trace data.
The PHP SDK does not exist but format is simple and well defined as Report traces via the Trace API (New Relic format)
Example
curl -i -H 'Content-Type: application/json' \
    -H 'Api-Key: YOUR_LICENSE_KEY' \
    -H 'Data-Format: newrelic' \
    -H 'Data-Format-Version: 1' \
    -X POST \
    -d '[
            {
                "common": {
                    "attributes": {
                        "service.name": "Test Service A",
                        "host": "host123.example.com"
                    }
                },
                "spans": [
                    {
                        "trace.id": "123456",
                        "id": "ABC",
                        "attributes": {
                            "duration.ms": 12.53,
                            "name": "/home"
                        }
                    },
                    {
                        "trace.id": "123456",
                        "id": "DEF",
                        "attributes": {
                            "error.message": "Invalid credentials",
                            "service.name": "Test Service A",
                            "host": "host456.example.com",
                            "duration.ms": 2.97,
                            "name": "/auth",
                            "parent.id": "ABC"
                        }
                    }
                ]
            }
        ]' 'https://trace-api.newrelic.com/trace/v1'
You must read specifics on how the OpenTracing data is rendered in UI
You must read how to decorate spans with mix of attributes by NewRelic proprietary attributes and OpenTelemetry reserved attributes
Key Learnings:
- The root span MUST be kind “server”
attributesspan.kind- It is only type that gets processed and shown properly in UI: APM Summary, Distributed tracing, APM Error rates, APM External services
- The JSON payload MUST be gzip compressed when sending to Tracing API, simply use
gzencode($jsonPayload) - Below is example of HTTP headers for API request, see SDK documentation for explanations
Content-Type: application/json Api-Key: your-newrelic-license-key-here X-Request-ID: xxxxxxxx-xxxx-xxxx-xxxx-xxxxxxxxxxxx Content-Encoding: GZIP Data-Format: newrelic Data-Format-Version: 1 User-Agent: NewRelic-PHP-TelemetrySDK/0.0.1 - The API endpoint for EU/non-EU accounts are different
- https://trace-api.eu.newrelic.com/trace/v1
- https://trace-api.newrelic.com/trace/v1
- When sending attributes, send mix of newrelic and OpenTelemetry attributes
telemetry.sdk.language: php service.name: myapplication.com host.name: gethostname() os.type: PHP_OS_FAMILY - To track errors within distributed tracing, need to include following attributes.
For error tracking,
http.status_codeis used Spans with kind of “server” or “consumer” and “otel.status_code” equals toERRORare considered errors. Transaction is only considered as an error if root span kind isserverandstatus.code=ERROR. If root span does not have a status code of ERROR, transaction not counted towards error rate.
Handling error rate in OpenTelemetry and New Relic
In our scenario, we are relying on Spans (not metrics) for our Services - OpenTelemetry page. If the root span doesn’t have a status code of ERROR, the transaction isn’t counted towards the error rate
Spans: When the error rate chart is derived from spans, all OpenTelemetry spans with kind of server or consumer and status code of ERROR are considered as an error. This means that the error rate from spans is protocol agnostic.
SELECT filter(count(*), WHERE otel.status_code = 'ERROR')/count(*)  as 'Error rate for all errors'
  FROM Span
 WHERE (entity.guid = 'foo')
   AND ((span.kind LIKE 'server' OR span.kind LIKE 'consumer' OR kind LIKE 'server' OR kind LIKE 'consumer'))
 SINCE 30 minutes ago TIMESERIES
Errors from spans (errors inbox) OpenTelemetry does not have a concept of a transaction, but it does have spans, and spans represent operations within a transaction. > New Relic relies on SpanKind for mapping trace data to our concept of a transaction. A SpanKind of server or consumer is used to identify the entry point of a process. In other words, these are spans that are either root spans or child spans of a remote process.
In addition to the lack of a definition of a transaction, OpenTelemetry does not include an explicit error rate metric.
In order to bridge the gap between New Relic and OpenTelemetry, transactions are defined by a span of kind server, with child spans making up the sub-operations of the transaction.
In this definition of a transaction, the transaction is only considered as an error if that root span of kind server has A status.code >of ERROR. Even if other child spans have a status code of ERROR, it only matters if the root span has a status code of ERROR. If the >root span doesn’t have a status code of ERROR, the transaction isn’t counted towards the error rate.

This is list of important attributes for errors in payload
error.class: %string%
stack.trace: %string%
error.expected: false
error.message: %string%
span.status: Error
status.code: ERROR
otel.status_code: ERROR
- New Relic currently uses
otel.status_descriptionto define an error.message
A simple PHP implementation of Collector/Tracer will need two simple interfaces
interface TraceCollectorInterface
{
    public function span(SpanInterface $span): void;
    public function commit(): void;
}
interface SpanInterface
{
    public const SPAN_SERVER = 'server';

    public const SPAN_CLIENT = 'client';

    public function getId(): string;

    public function end();

    public function setKindType(string $kind): void;

    public function setParentIdentifier(string $spanIdentifier): void;

    public function setTraceIdentifier(string $id): void;

    public function setAttributes(array $attributes): void;
}
Span has reserved important attributes:
idthis is hex 16 characters, string,bin2hex(random_bytes(8))trace.idthis is hex 32characters, string,bin2hex(random_bytes(16))timestampthis is millisecond precision time of beginning of span, intattributesarray of newrelic/openTelemetry attributesnamename of root span will be rendered in UI, stringparent.idid of parent span, for nested spans, stringspan.kindkind of span, see specspan.statusstringErroror MUST be unset if HTTP status in the 1xx, 2xx or 3xx rangesduration.msduration of span in milliseconds, this value is related to timestamp, inthttp.urlurl of request, stringhttp.methodmethod of request, stringurl.queryquery part of request URL, stringhttp.statusCodehttp status code, stringhttp.status_codehttp status code, stringotel.status_coderepresents same as status code usuallyOK
Example successfull trace JSON payload
    {
        "common": {
            "attributes": {
                "service.name": "users.myapp.com",
                "host.name": "bd1905499866",
                "os.type": "Linux",
                "telemetry.sdk.language": "php"
            }
        },
        "spans": [
            {
                "id": "ccdde11c5d2f4df0",
                "timestamp": 1750794805356,
                "attributes": {
                    "name": "/signup",
                    "span.kind": "server",
                    "duration.ms": 6397
                },
                "trace.id": "0197a3809ff2707997cef8906a167232"
            }
        ]
    }
Example error trace JSON payload
    {
        "common": {
            "attributes": {
                "service.name": "users.myapp.com",
                "host.name": "bd1905499866",
                "os.type": "Linux",
                "telemetry.sdk.language": "php"
            }
        },
        "spans": [
            {
                "id": "47968e0ac50dcccf",
                "timestamp": 1750795646152,
                "attributes": {
                    "name": "/signup",
                    "span.kind": "server",
                    "duration.ms": 1188
                },
                "trace.id": "0197a38d749370e8a01448e820c3fbc5"
            },
            {
                "id": "39d44147a918ef26",
                "timestamp": 1750795646334,
                "attributes": {
                    "duration.ms": 327,
                    "error.class": "GuzzleHttp\\Exception\\RequestException",
                    "error.expected": false,
                    "error.message": "cURL error 1",
                    "http.method": "GET",
                    "http.statusCode": 0,
                    "http.status_code": 0,
                    "http.url": "httpx:\/\/users.myapp.com\/signup",
                    "otel.status_code": "ERROR",
                    "otel.status_description": "cURL error 1",
                    "span.kind": "server",
                    "span.status": "Error",
                    "stack.trace": "...",
                    "status.code": "ERROR",
                    "url.query": "referrer=true&campaign=yes",
                    "name": "POST users.myapp.com",
                    "parent.id": "47968e0ac50dcccf"
                },
                "trace.id": "0197a38d749370e8a01448e820c3fbc5"
            }
        ]
    }
Summary
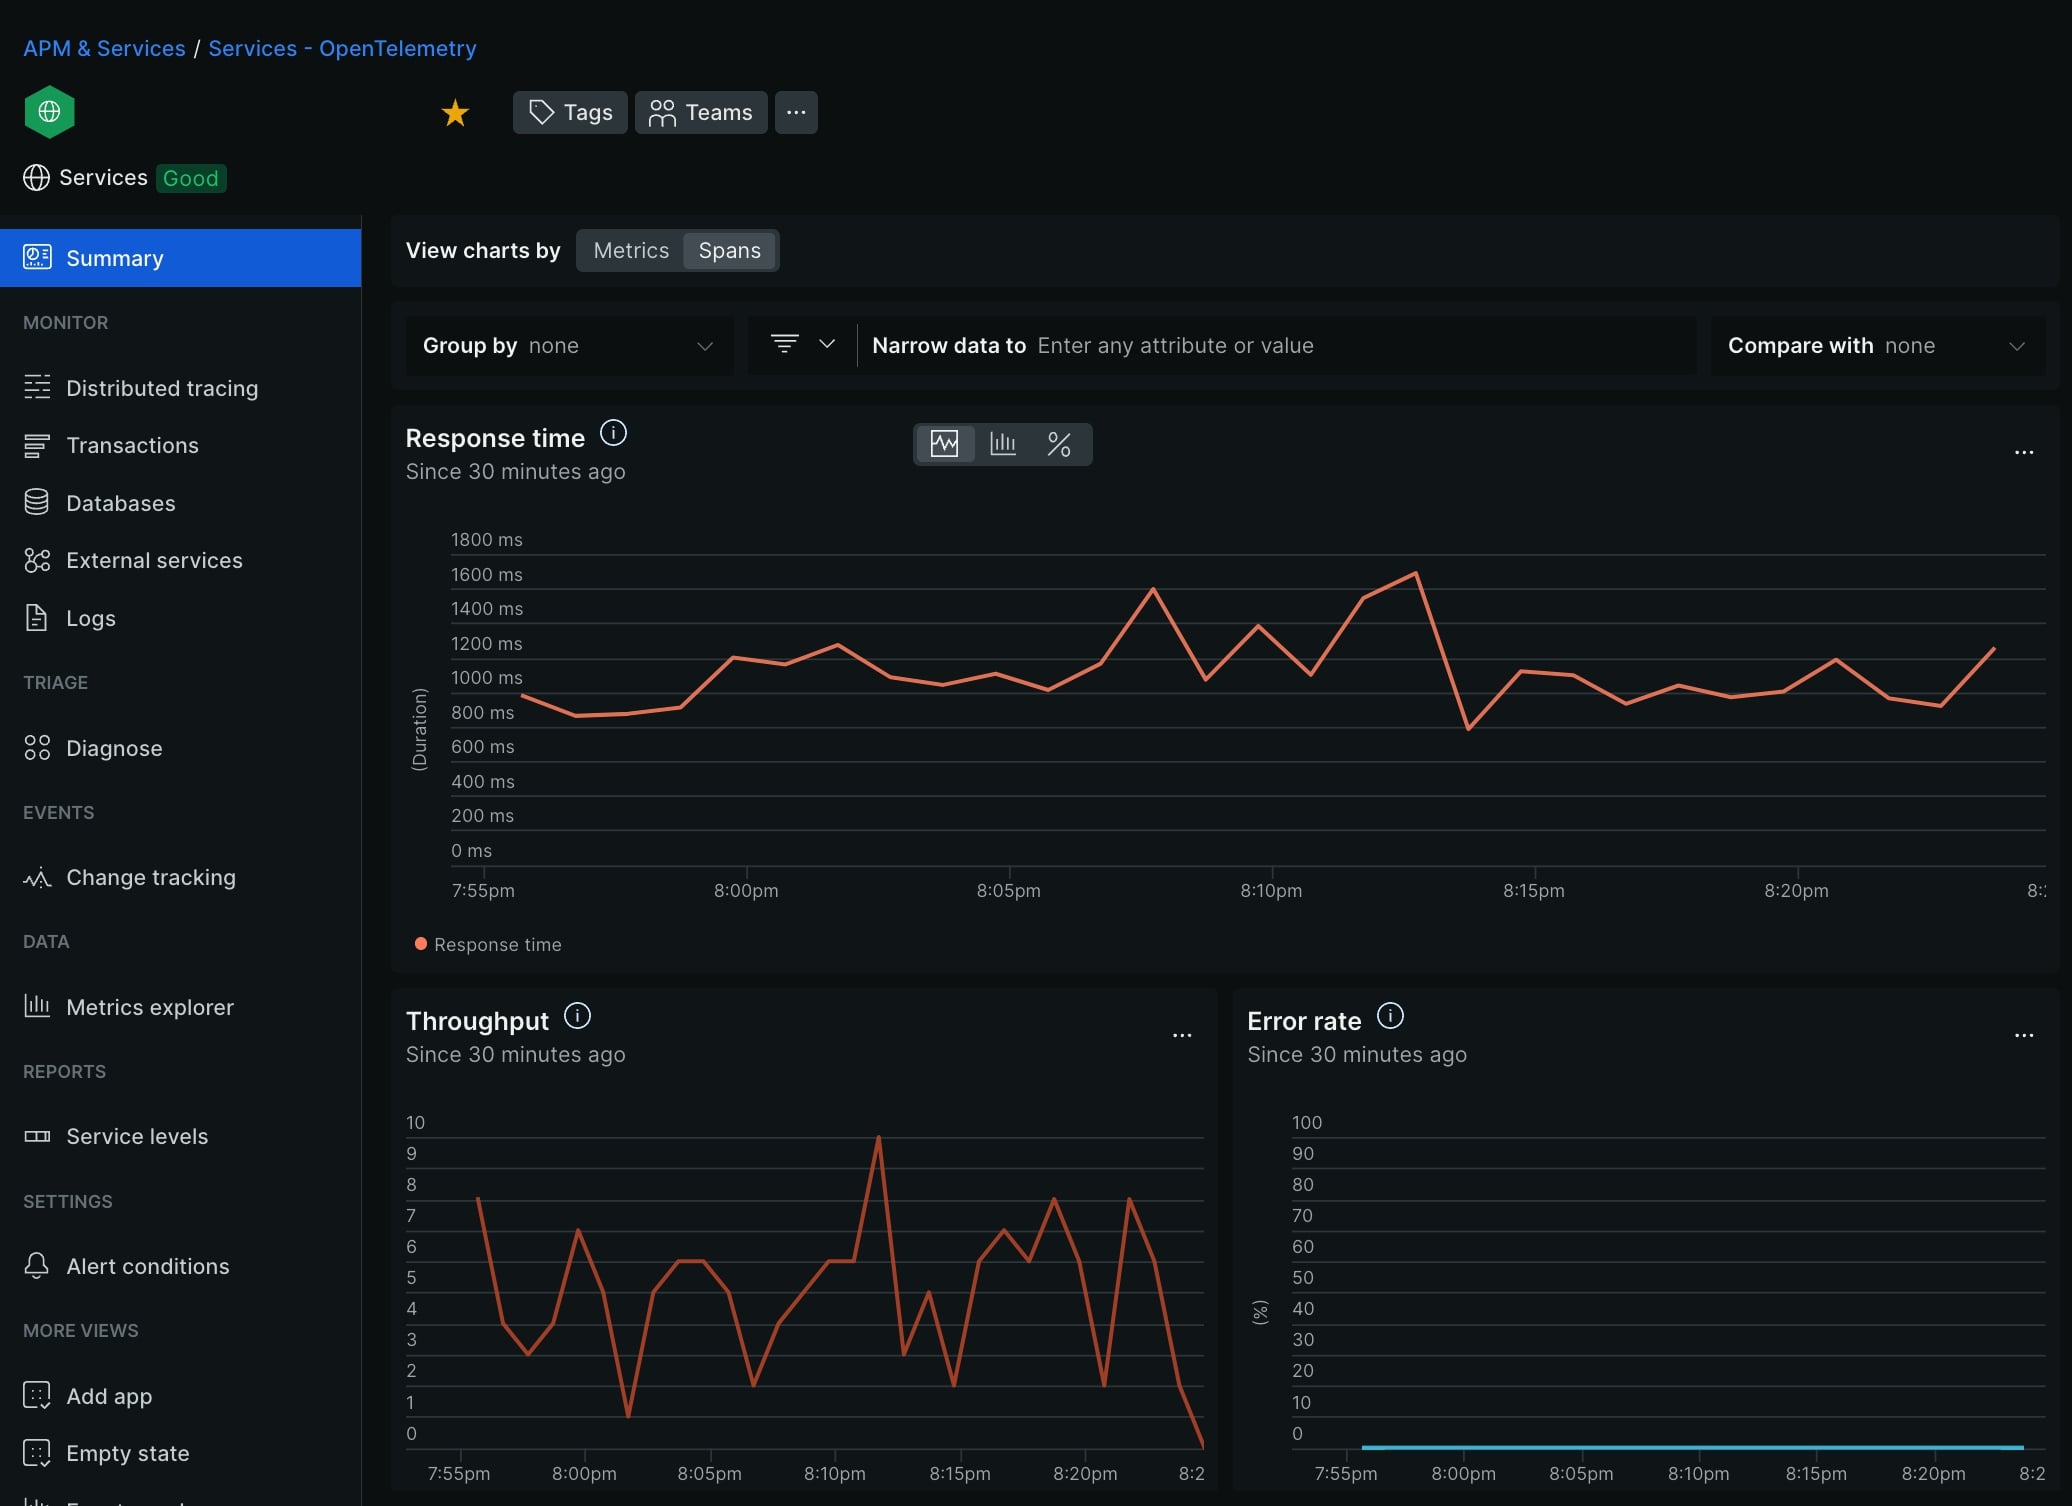
Using example payloads it is possible for NewRelic APM to correctly display information
- Throughput
- Response time
- Error rate
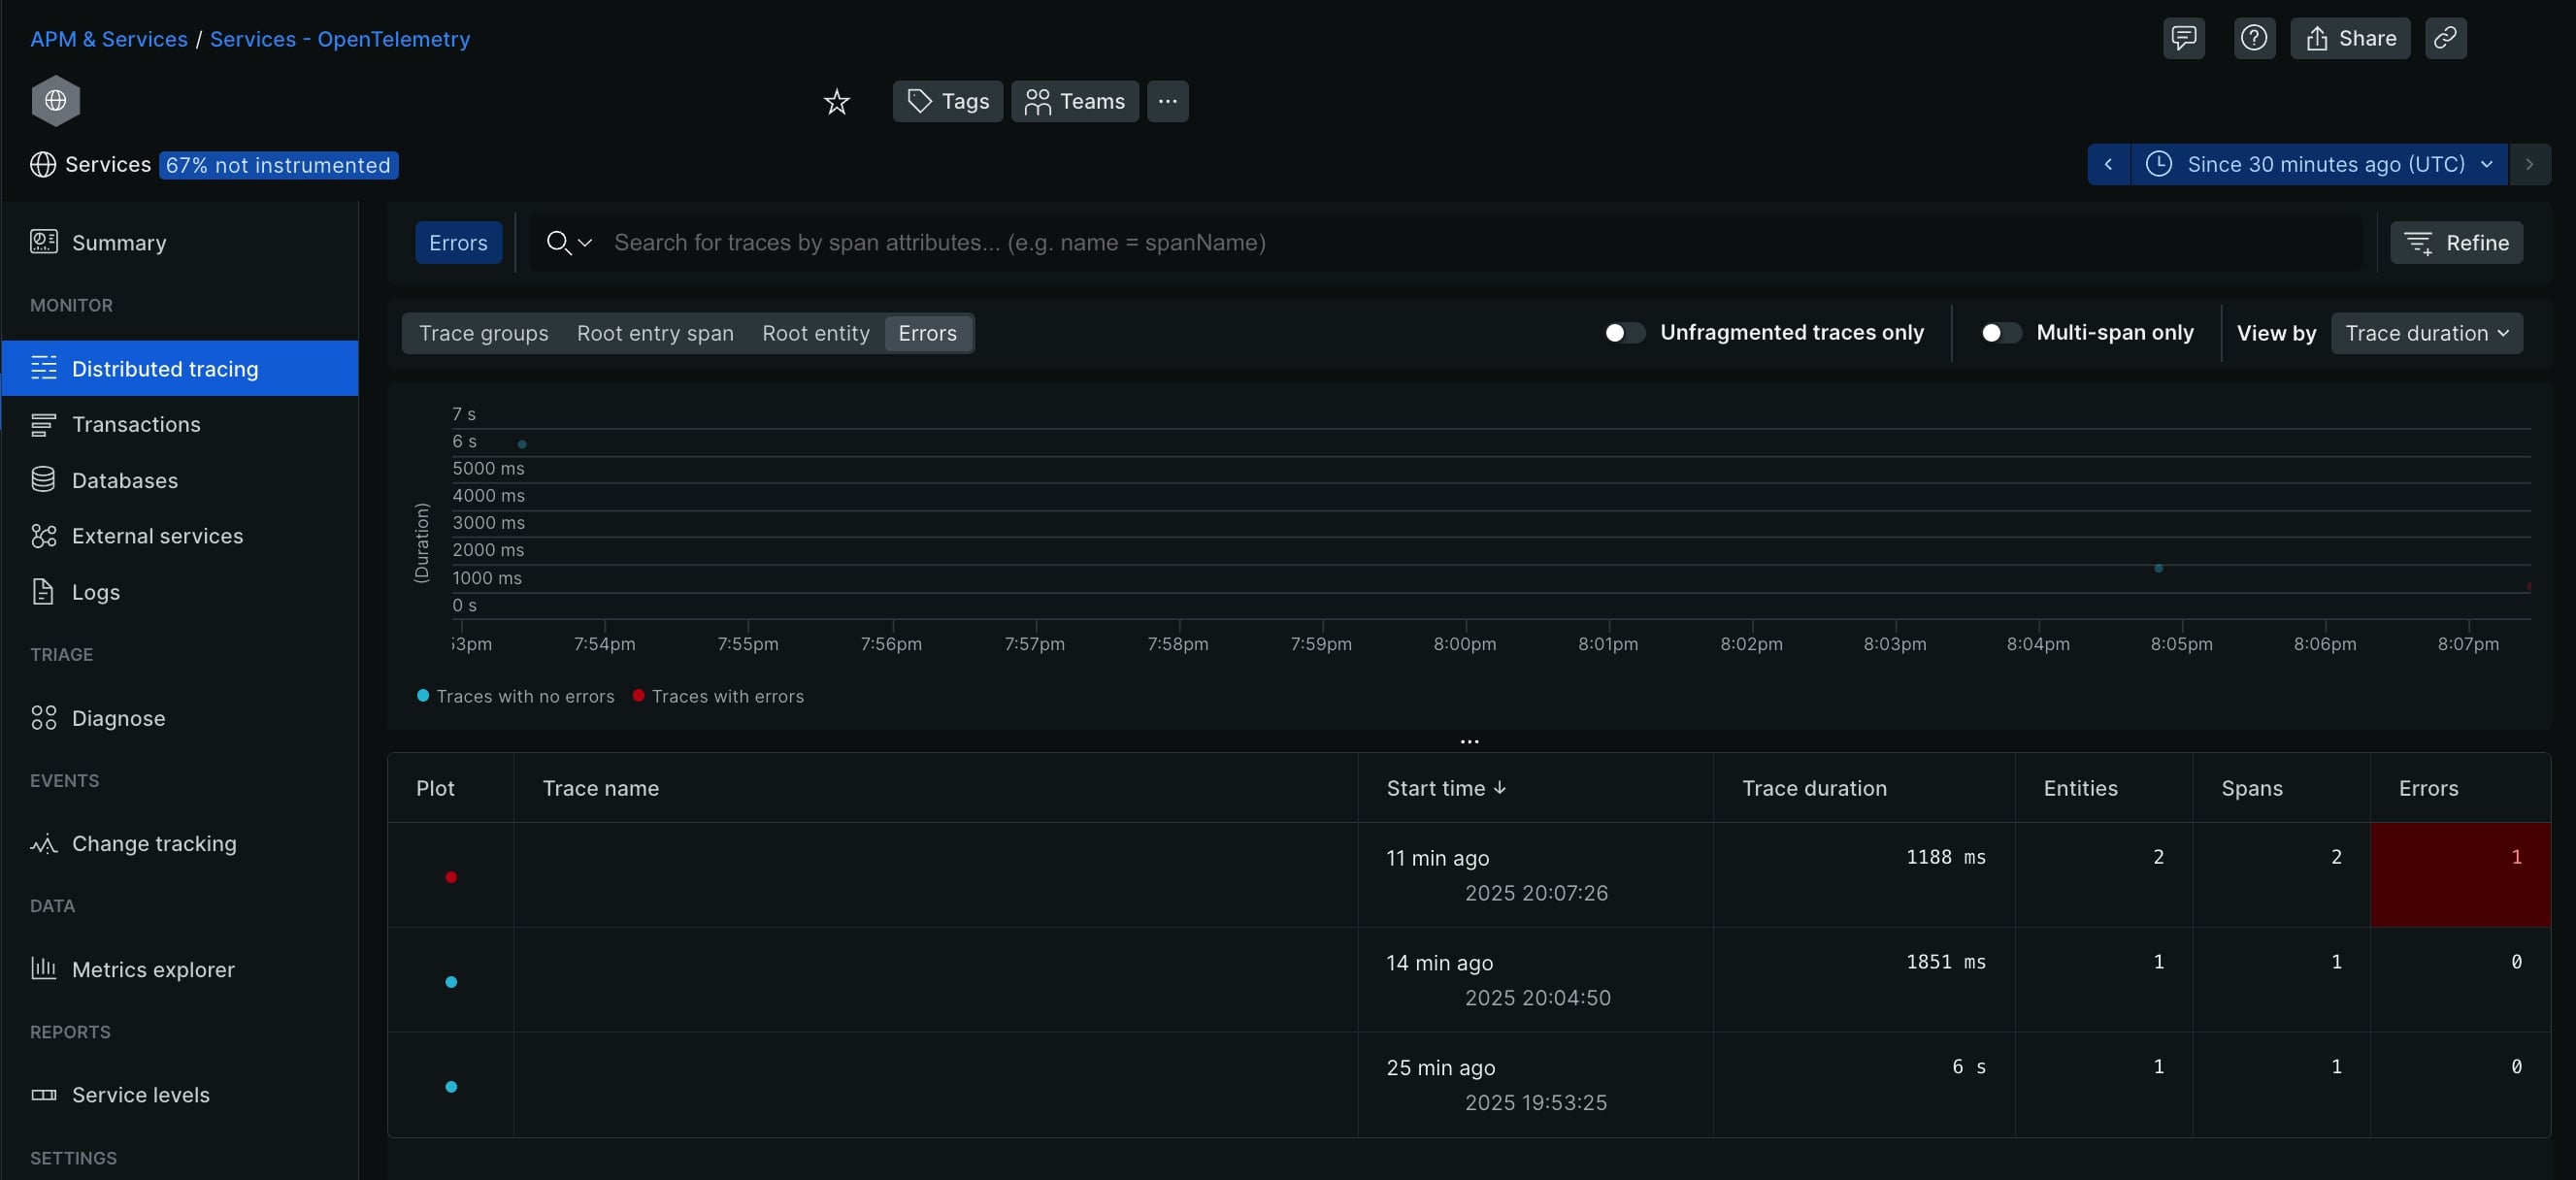
- Distributed Tracing
While concrete implementation is not provided here. Collector is a simple class injected with http client and serializer that accumulates collection of spans. Span is a simple class with getters/setters with main purpose is to track start & end time.
Future implementation improvements may include
- configuring minimum span duration threshold to be instrumented at all, hiding tiny/small non-interesting spans
- configuring minimum total amount of spans needed before commit
- configuring minimum total span duration needed before commit
References
- NewRelic SDK specification
- NewRelic datacenters
- NewRelic Trace API
- OTEL reserved attributes
- NewRelic Span attributes decorations
- OpenTelemetry http attributes
- OpenTelemetry Transformation to non-OTLP Formats
- OpenTelemetry Span Kind
- OpenTelemetry Trace concepts
- OpenTelemetry General attributes
- Handling error rate in OpenTelemetry and New Relic
https://moar.sshilko.com/2025/06/24/NewRelic-Distributed-Tracing